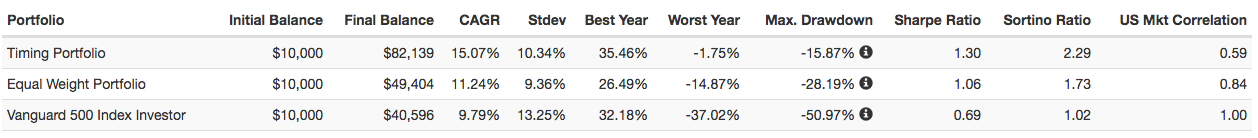
I think it’s important to take into account the importance of evaluating a strategy, or a portfolio, through more than just one indicator. For example, the following strategy has a correlation of 0.59 with the market, since 2003. For some people, this level could be considered high.
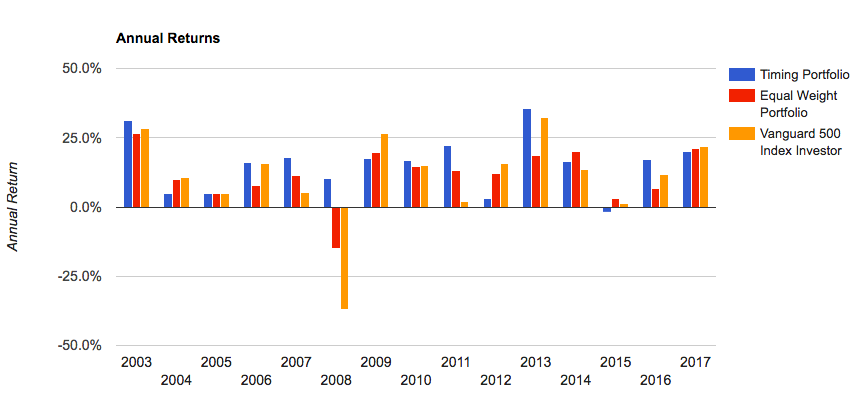
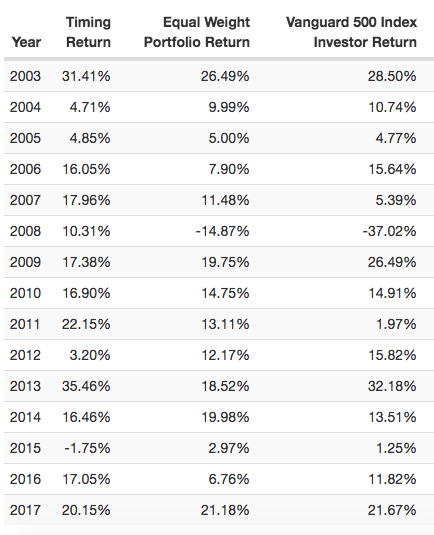
However, this strategy registers an Alpha of 9.88%, an R2 of 35.58%, Sharpe of 1.30 and Sortino of 2.29. During 2008, this strategy obtained a return of + 10.31%. A high or low correlation with the market only explains a small fraction of a model.

I respectfully disagree with this assertion. The correlation of our models within a portfolio is in my view one of the key elements to take in consideration especially because this parameter, along with the variance of each component of the model, is directly associated with the optimal position size (and leverage) we should trade to achieve the highest return possible without going bankrupt providing that “highest return” is only our target. Having said that, correlation can depict different situations; In other words the results we obtain from our analysis and studies are useful only if the inputs we throw in (in the study) are meant to get what we are really looking for. On this regard, I really wish that C2 will take in consideration to extend, implement new “format” to list the performance of the strategies. Perhaps the most notable would be to add a trade list that we can export in excel where the meaning associated to “trade” is not a sequence of trades before to go flat. (as currently is) //// Beside to stay on topic, what we really want to discover is what really correlation is when markets move in excess of 2- 3 standard deviations. On those more “Incidental days,” You will find out that what was not correlated a blink of eyes before all suddenly is. (and so many strategies as well) As many others have pointed up before we do not have such extended environment to test out but we have some data points that although probably not very statistical significant can provide some interesting hint. It goes without saying that what remain left in the tool of the investor/trader to address this unwanted characteristics of the market is once again the position size at the portfolio level and the choosing of systems/financial instruments that are able to provide their Alpha during stress scenarios. Note that as an extreme example, even negative expectancy components when traded alone, are extremely beneficial when traded (for example) within some highly speculative portfolios. Saluti.
Thank you very much for your comment. I think there are different ways to build portfolios in an adequate way and all of them are highly respected. Both my strategies and the risk management I use are based mainly on very long-term studies.
There are numerous empirical information that show the benefits obtained by combining several parameters in the construction of portfolios.
I personally would not use a single parameter in this process. However, I understand that each person has a different risk profile and that is very respectable. Regards.
1 Like
