recently some of my user in my user group has some very interesting discussion about relationship between win/loss trade ratio and profit return. The system has an average of 60% win/loss trade ratio (since Jan 2017) , some user think this is great, some think is not good enough. Below are discussion details, there are all in Chinese and I have put translation beside it:
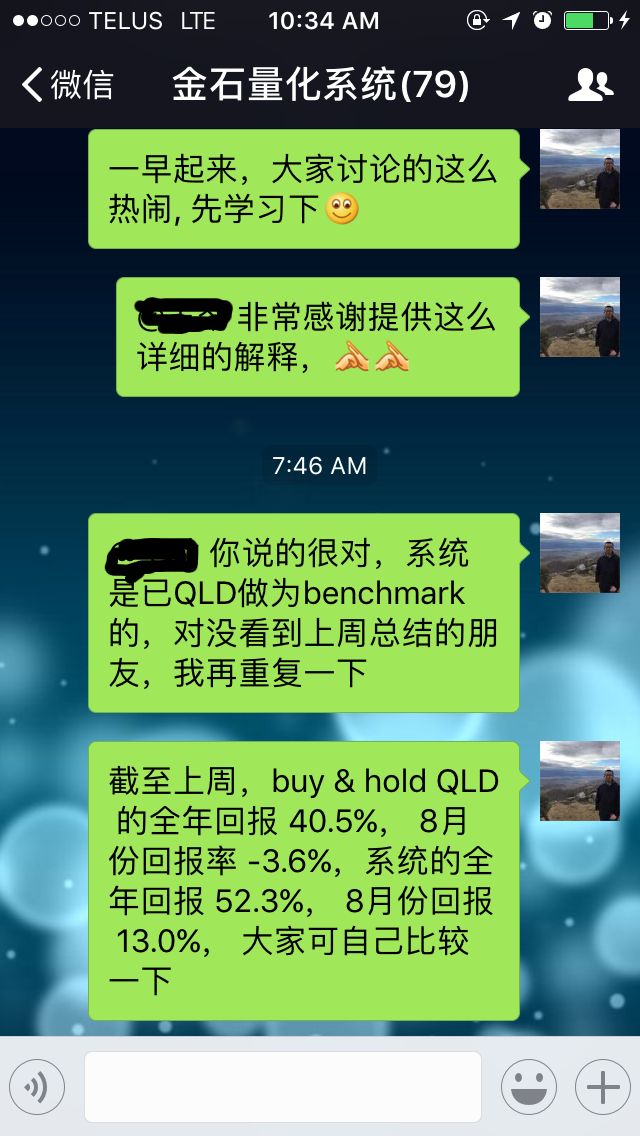
The system uses QLD as bench mark, Until end of last week B&H QLD YTD return is 40.5, august return is -3.6%, while the system’s YTD return is 52.3%, and August return is 13.0%
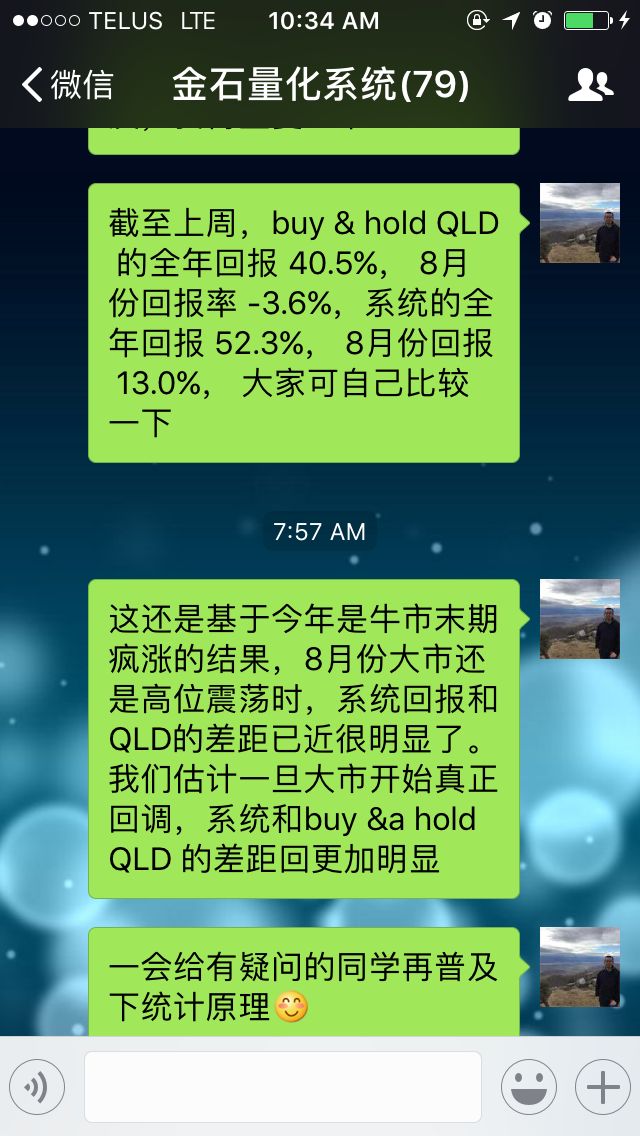
This result is based on “crazy rise” at the end of bull market. When the market starts to show high volatility since August, we can see the system performs much better than B&H QLD. We are expecting the system will perform even better when the real correction starts.

There are two principles I would like to explain: 1) if you trust something, or a system, or what so ever, you will need to follow it 100%. 2) if you have any doubt or question, go spend sometime to understand how it works, instead of directly jump, and don’t know what is going on. There are lots of user here did lots of homework, asked lots of questions before subscription.

Our system is based on statistics. What statistics does is to find the pattern from large size of samples. Similarly, large sample size has to be used to verify the statistics result. Our system is based on monthly and quarterly return, just looking at return in a week doesn’t make any sense.
The system performance already include commissioning. total number of trades YTD is 130, and average holding time is 2.4 days.
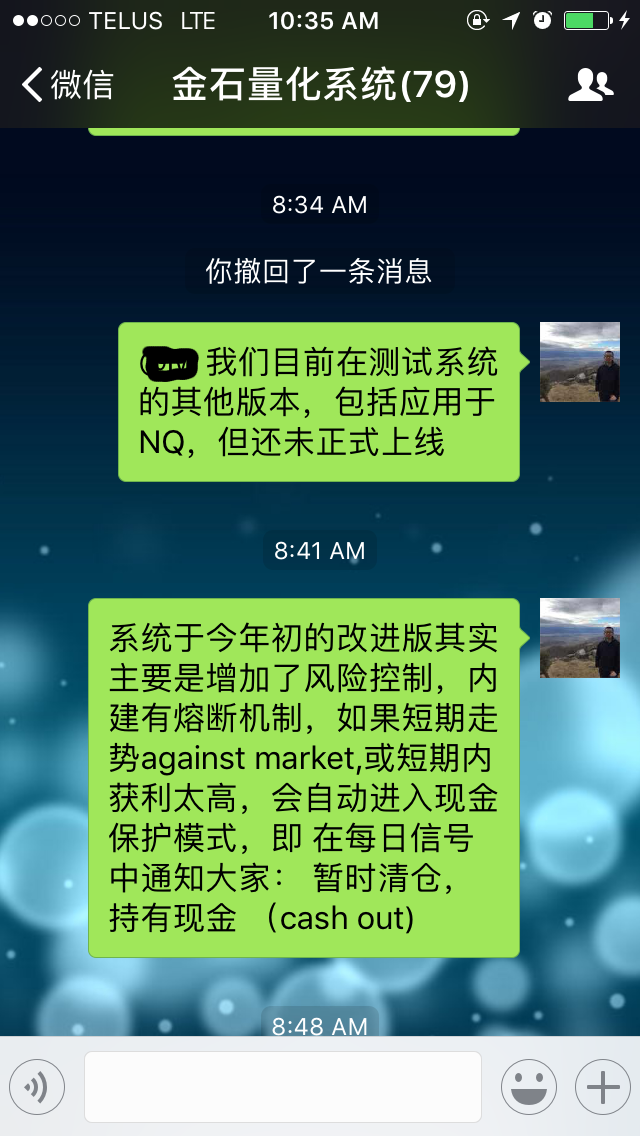
The major improvement we did early this year is to include risk management elements, which will put the system into CASH protection mode if 1) the short term system result is against the market, 2) accumulated huge profit in short period of time.
Hope fully this provide some useful information for you.
Our system link: https://www.collective2.com/details/98531369
Our Site: https://goldenstonefund.wixsite.com/index
Thanks
Henry
