It is easy to see that this is the total return (not annual return) for the full testing period, simply by comparing to the S&P500 that has a known return, in the same graph.
@MatthewKlein, I agree that what we can do here with such a tool is exactly the “wastebasket” type of overfitting. That’s what prompted my earlier remark about overly optimized backtesting. Each slide of the sliders gives another shot at the wastebasket. It’s still useful, and fun, but potentially dangerous as well, nothing to follow blindly, as you well point out.
Hi guys,
I’m in a very different time zone, so sorry for the delay in responding.
First about the Return value on the main tab.
Yes, this is the result of the entire test period.
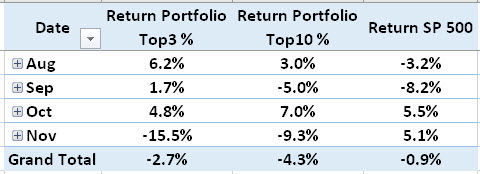
You can see details by year and month on the Summary tab
As for overfitting.
Doubt is our constant companion. In no way would I call for investing in it now. We have to wait for the results of real-time testing.
Matthew makes a logical suggestion to use out-of-sample testing.
It would be something like double out-of-sample testing. Current out-of-sample testing as a rebalance period and global out-of-sample testing for example 2018-2020 is in sample, 2021-2022 is out of sample.
And imagine if we add a couple of parameters to the tool with a range of in sample and out of sample. What will prevent us from moving the sliders in the same way until we get a good result on out of sample?
I think the best out-of-sample testing is real-time testing, at least on a paper account. This alone ensures that we avoid overfitting.
But if you think a global in-sample and out-of-sample period could add objectivity, I can add that to the roadmap. But it would take time to implement, quite a complicated thing.
1 Like
A good way to check the stability of the ranking formula and reduce the overfitting is to look at the results of the same formula for different portfolio sizes: 3, 4, 5, 6, 7, etc.
If the equity curve changes drastically, that’s a bad sign.
This looks great, share the results of this formula for different portfolio sizes please.
Please include the drawdown of the top 3% and top 10% systems (plus the drawdown of the S&P 500 itself) in your total portfolio table.
Good idea, I’ll think about how best to implement it visually.
Hi,
So according to your chart this system is making 19.24% a year on average (assuming profits are always reinvested), correct?
Hi,
There ara many charts in this thread already. Not sure where you get 19.24%
In real-time are testing of 2 portfolios: top 3 and top 10.
For current moment Top 3 shows:

avg year return = 212% / 5(years) = 42.4%
Top 10

avg year return = 104% / 5(years) = 20.8%
Percentage return is calculated as return in dollars divided by average portfolio size, without reinvestment.
Hi,
It’s from your table here: C2-return hosted at ImgBB — ImgBB
(141% return in 5 years, compounded)
That’s one way to do it, but if a system is highly profitable, it would be extremely foolish not to re-invest all the profits after each winning trade (that’s precisely how great traders make millions), without changing the risk per trade in percentage, of course.
Keep up the good work.
1 Like
Greetings!
Below you will find the latest updates, the big loss in real-time testing and the strategies that affected it. Thanks for your interest!
Tool under development for building and testing a portfolio of strategies: https://daniilr.pythonanywhere.com/
Tool updates.
- New the max portfolio size calculation. Now it displays the amount of maximum capital allocation used for each month.
Example:
We have to rebalance points in one month.
- At first rebalance we got a portfolio of 3 strategies.
Their model account sizes are: 30K, 25K, 40K.
Sum of allocation: 30K + 25K + 40K = 95K - At second rebalance we got a portfolio of 3 strategies.
Their model account sizes are: 15K, 20K, 45K.
Sum of allocation: 15K + 20K + 40K = 75K
Max capital allocation of this month is 95K

- For comparing the results with the benchmark, added the SP500 data to the monthly table results and to the yearly graphs.
The SP500 Annual Return in the table is for the reporting year. That is, on the first day of the new year it resets and the Annual Return for January will be equal to the result for January.


- Added portfolio drawdown for the reporting year.

Plans for the next update
Okay, point “Add monthly and yearly performance data” is done.
Next is:
- Add max leverage filter
- Expand logs data (add more data about scoring count)
Real-time testing
Big loss this month. And I would like to take this situation apart for future improvements in methodology.
November Performance.


Compare with backtest
Backtest has a time lag, so it ends at 2022–11–21
Portfolio Top3 backtest

Portfolio Top10 backtest

There are differences in the relative drawdown. So far I will not focus on this, because there is a lag in the data. Later I will find out the reason for the discrepancy.
Okay, let’s look at Nov outsiders

- Mini dax and ES | Mini dax and ES
It’s pretty obvious. A sharp change in behavior: a significant increase in leverage and blown up.
The area of behavioral analysis, already approaching it in the roadmap.

- Algebra Crypto | Algebra Crypto
I can only highlight a fairly high level of correlation with the SP500.

3x SPX BULL — BEAR QUANT | 3x SPX BULL - BEAR QUANT
3x QQQ BULL — BEAR QUANT | 3x QQQ BULL - BEAR QUANT
Trading leverage stocks. We can’t see this in the leverage attribute. Without reading the details we can see the hidden risk only in abnormally profitable months in the past. Where there are high returns, there are high risks.


That’s all for now, thanks for your interest and comments! A couple of ideas from the community have already been added to the roadmap.
Also I would be glad to hear your thoughts on the risk evaluation of such strategies mentioned above.
4 Likes
Happy New Year!
Wish you to make much profit in 2023!
Real-time testing
December was a good month, although it did not bring back the losses of November.
Performance during the testing period in 2022, from August to December:
▮ The top 3 portfolio outperformed the SP500 by 9.7% (Top3 +2.9%. SP500 -6.8%)
▮ The top 10 portfolio outperformed the SP500 by 10.6% (Top10 +3.8%. SP500 -6.8%)


In December, there were no obvious outsiders in the portfolio.

So let’s look at Top Strategies for December.
No matter how dangerous some of these strategies look, they were the ones that gave the bulk of the portfolio profit in December.
https://collective2.com/details/141381402
Interesting strategy
Performance: +$5478
- Top 1 in the C2 ranking
- Short-term trades (intraday) on stocks once a month
- And almost no subscribers, apparently confused by the tactic of rare once a month trades
https://collective2.com/details/139682545
Tesla fan strategy ![]()
Performance: +$11792
- Top 2 in the C2 ranking
- Tesla stocks only
- A lot of subscribers
https://collective2.com/details/140767231
Great equity curve for last 3 month
Performance: +$5141
- Top 3 in the C2 rank
- Trading futures, max leverage 13.68
- It looks like an intraday, but if check it out, it turns out not quite so

Tool Updates
- Added max leverage limit attribute.
Value 0 — attribute off.
Value >0 means that a portfolio can include strategies with less or equal value only.


- Expanded info on Log Tab
Added:
- stat values
- score for every attribute in the game
- link to the strategy

- Fixed several minor bugs.
That’s all for now, thanks for your interest!
Daniil R.
2 Likes
Do you have a good way to directly compare the forward test and the equivalent backtest in the same chart?
Great work
1 Like
Not yet. I was just thinking the other day how to implement it. Will add it in the next updates.
1 Like
Hi,
January was flat. A flat on the equity of the smart portfolios, and no new significant updates of the backtesting tool.
Real-time testing


By strategy

Stay away from TESLA S ($TSLA) strategy by Andy Song, he puts in auto trade himself and doesn’t take well to questions or comments. He is buying at TOP and then Tesla is tanking and Selling at Bottom and then Tesla is rising, seems like he is trading his own money on reverse of the trades he is showing on C2 and minting millions, very shady and nasty, stay away !!!
In other words he buys the dip and sells the rip, one of the oldest trading techniques commonly used by savvy traders .
