Smart Portfolio based on the author's rank method | Backtests & Real-Time Testing

Greetings, community!

Before I begin describing my research so far, let me first explain why I am working on this project. I am now part of C2’s still small (but hopefully growing) Quant Research Team. Matthew has asked me to analyze ways that investors can use C2’s data and tools to improve their investing using the C2 platform.

(While neither I nor C2 can guarantee that anything I write here will result in profitable trading, what follows is the result of some of my research so far.)

Ok, let’s start.

I often catch myself thinking “Just a little bit more improvements and ready to launch”. But then one week follows the other.

Enough of waiting! It’s time to launch and improve on the go.

I’d like to present you my ranking method: the idea, backtest method and launch of the SmartPortfolio simulation.

In this thread, I will publish the portfolio results after each rebalancing (every 15 days), and the backtest results of recent versions of the rank method.

Your comments and suggestions are appreciated, and the most interesting ones might be incorporated into the rank method development.

▌ Idea

I can’t provide the formula, as it will probably be used in future updates of C2Scoring, but I will try to convey its meaning.

I started with the idea that a trading strategy should be evaluated not by profitability metrics, but primarily by risk and behavior metrics. This will reveal antifragile strategies that are more stable. Therefore, this adds predictive value to the scoring.

In my work I use the powerful C2 Scoring Workbench tool.

There are various strategy stats available there, and developers constantly add new ones.

Based on these stats, I have created a set of my own metrics.

I have identified three groups of stats (I call them metrics): risk, behavior and profitability.

Each metric (stats group) can score a maximum of 33 points, which are evenly distributed among all the stats in the group.

Example

Risk metrics.

  • Max Drawdown
  • Max Open Loss for different periods of time

Behavior metrics.

  • Strategy age
  • Trades quantity
  • Win month percentage

Profitability metrics.

  • Alpha
  • Sharpe Ratio
  • Win month probability

▌ Backtest

Method

I used forward-backtesting at 15 days’ intervals (portfolio rebalancing every 15 days), resulting in 2 backtests per month, 24 per year.
Backrests’ period from Feb.2018 to Dec.2020.
In my Excel model, I considered the setting of stop loss by Max Drawdown and Max Open Loss.

Strategy Model Account Size
The best Strategy Model Account Size in portfolio is between 40,000 and 70,000; I’ll explain it below.

I noticed that the best results come from portfolios where the Strategy Model Account Size (hereinafter SMAS) is between 25,000 and 75,000 and finally decided to find out why.
First, I plotted chart of the quantity of the strategy by SMAS


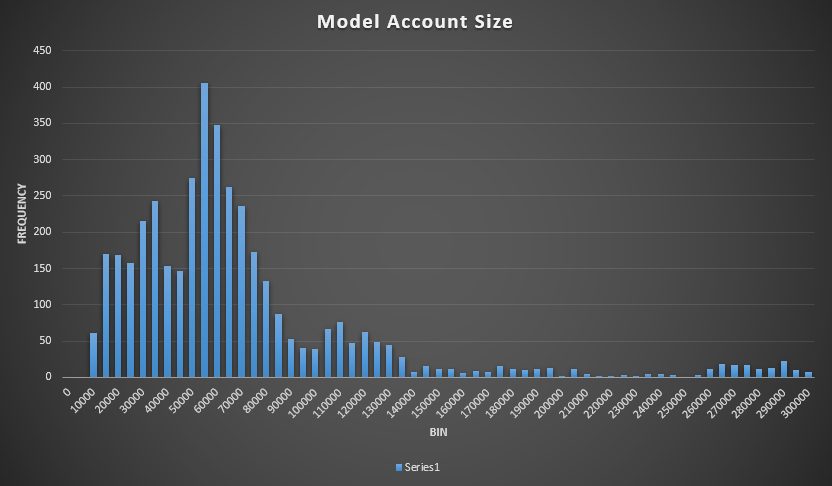
58.5% of strategies lie within the range from 25,000 to 75,000, which is not so much for the conclusion in favor of the quantity.

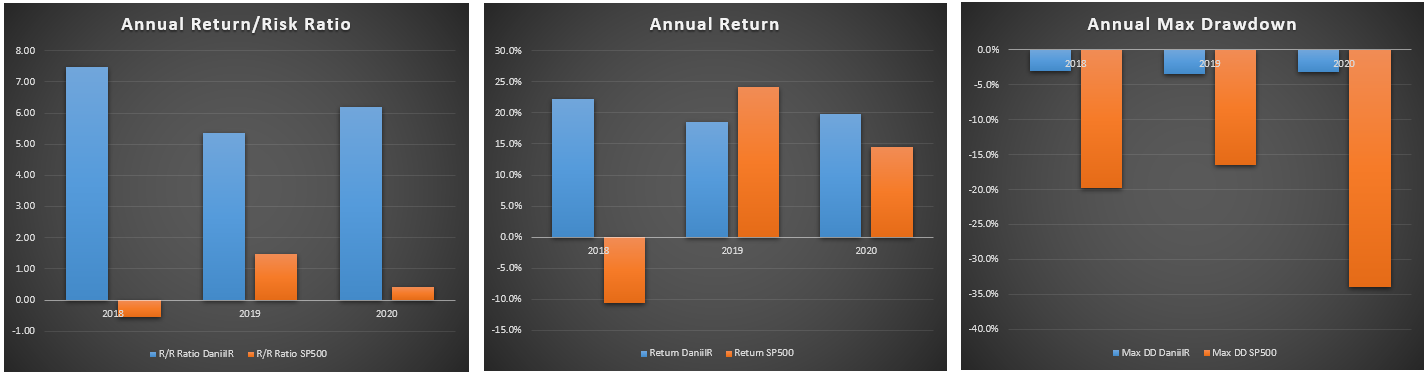
So, I plotted a chart of the quantity of the strategy that gained >= 90 scores (In my rank method maximum is 99) by SMAS.


82.5% of strategies lie within the range from 25,000 to 75,000.
76.2% within the range from 40,000 to 70,000.
This is already significant. I don’t know why this is, but it answers the question of why a portfolio in these ranges performs the best. It’s just that the best strategies are concentrated in this range.

Results


▌ SmartPortfolio launch
Based on the results of the backtest, I wanted to launch SmartPortfolio.
But since the minimum Strategy Model Account Size option has not yet implemented, the SmartPortfolio will be limited to only the maximum Strategy Model Account Size ($70,000).

For this scenario, the backtest looks like this


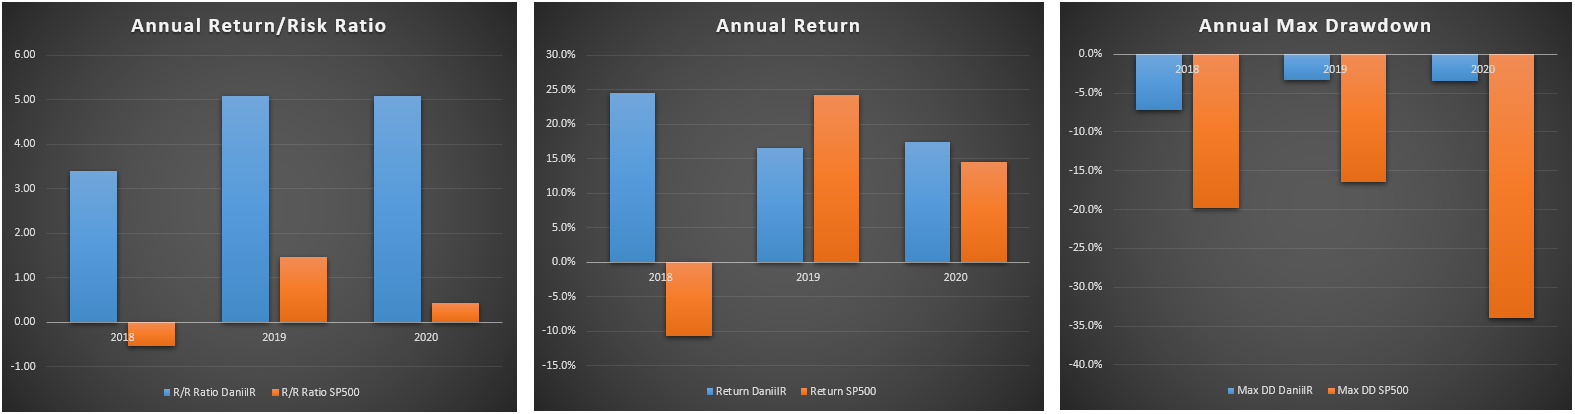
This variant is less balanced, since strategies with 20,000 and 70,000 can fall into the portfolio at the same time and their total contribution will differ. Nevertheless, it still looks like a working version. I’ll update it later when the Minimum Account Size option will be ready.

And so, from 03-May-2021 the Smart Portfolio is now up and running!

SmartPortfolio setup menu


And Launched!
Here are the first five strategies selected by rank method DaniilR (v.2.3.5) for the next 15 days

4 Likes

what does an equal risk portfolio for the same programs look?
what does 1/n allocation for these programs look?
how does covariance between programs color your opinions?
where does leverage come into play? if you rescale allocations to 1X across all programs, does that affect the risk-adjusted results?
what is the Effective Number of Bets across the entire meta-portolio on a daily basis?
are these all or mostly long-only? is this a concern?
what are the p-values for any of your estimates over such a short time horizon?
why is account size something you are focused on?

Hi @GeorgeColes
I presented all that was counted now. I will keep you updated with new data.

what does 1/n allocation for these programs look?

If you mean allocation by markets, then there is no such data in the workbench, I can only calculate it separately for each market.
Now it works like this: if at the moment futures strategies are gaining more points, then the portfolio will consist of them, and vice versa.

where does leverage come into play? if you rescale allocations to 1X across all programs, does that affect the risk-adjusted results?

It seems like your question about a stock portfolio, because leverage is already used in strategies. Here the question is what leverage is used in strategies/portfolio and whether they allow the investor to scale the return (there is no answer yet).

what is the Effective Number of Bets across the entire meta-portolio on a daily basis?

Sorry, I do not understand what you mean.

are these all or mostly long-only? is this a concern?

Do you mean long-only strategy?

what are the p-values for any of your estimates over such a short time horizon?

Do you mean win probability of next 15 days period?

why is account size something you are focused on?

I want to achieve a balanced portfolio in terms of contribution to overall return.
For example, now there is no lower border for Model Account Size in the SmartPortfolio setup. If we select maximum Model Account Size = 70,000, that means that in portfolio can be strategy with 18,000 (or lower) and 70,000 at the same time, and contribution of strategy with 18,000 is simply less significant. 1% of 18,000 = 180 and 1% of 70,000 = 700

I noticed that the best results come from portfolios where the Strategy Model Account Size (hereinafter SMAS) is between 25,000 and 75,000 and finally decided to find out why.

Do you think there is bias? In C2, most clients won’t put so much money. Also, clients need to pay subscription fee. This explains why account size is between 25,000 and 75,000.

In general - yes.

My opinion is that this is due to two factors:

  1. To show good statistics on the maximum drawdown on futures, or with a good portfolio of stocks, either trader need to trade micro futures and cheap stocks, or specify a model account of over 30,000.

  2. A trader’s income is only the cost of a subscription. To get $100 per subscriber, you need to set a price $200. At 50,000 it is 0.4%, and at 10,000 it is 2%, which is already very significant. It turns out that the trader either needs to lower the subscription cost, or increase the strategy model account size.

Theoretically, most strategies use only a part of the available leverage and this makes it possible to form a portfolio with a smaller amount, but I have not yet figured out how to check this. Maybe you have some ideas?

Risk metrics.

  • Max Drawdown
  • Max Open Loss for different periods of time

Behavior metrics.

  • Strategy age
  • Trades quantity
  • Win month percentage

Profitability metrics.

  • Alpha
  • Sharpe Ratio
  • Win month probability

These are important features to estimate strategy’s sustainability, but account size should not be put into Profitability metrics because I think account size is not correlated with future performance.

Lager account size only means that the trader can do intraday trading or he is using a portfolio margin account instead of Reg T. Maybe Behavior metrics is more suitable?

I think Collective2 could refer to FundSeeder’s FS Score for enhancing C2 scoring.

[https://fundseeder.com/FundSeeder%20Analytics%20Manual.pdf]
https://quantdare.com/probabilistic-sharpe-ratio/

1 Like

Perhaps you misunderstood my writing. The account size does not contribute to the scoring formula in any way.
For a balanced portfolio, it is necessary that the strategy model account size be approximately the same, then the contribution of each strategy will be relatively equal.
And based on this idea, it is better to form a portfolio with strategies model account size of 40,000 - 70,000, since this range will contain the maximum number of strategies for scoring.

I agree about the Behavior metrics, I believe this is key, but so far I have few statistics in the workbench to develop this research.

For this, a special thank you! Very interesting, I will discuss with the team the possibility of adding this stat.
I doubt that by itself it will have real predictive value, but in a bunch of metrics it can contribute.

2 Likes

For this, a special thank you! Very interesting, I will discuss with the team the possibility of adding this stat.
I doubt that by itself it will have real predictive value, but in a bunch of metrics, it can contribute.

Here is the research paper published by David H. Bailey and Marcos Lopez de Prado.

2 Likes