Smart Portfolios based on the ranking method of C2Star Program. Historical backtests and real-time testing

Hey there, Collective2 Community!

Matthew gave me a unique opportunity to test the performance of smart portfolios on various ranking methods.

This thread will be dedicated to testing Smart Portfolios based on strategies from the C2Star Program.

If you haven’t heard about Smart Portfolios, check the link below:
https://collective2.com/smartportfolios

The main idea is that you choose the ranking method, set the conditions acceptable for your capital, rebalancing frequency, and then C2 automatically subscribes you to the Top N strategies every N days according to the selected rank method.

Of course, some natural questions arise:

  • what are the risks?
  • what are the returns?
  • how long are portfolio drawdowns?

These questions I want to discuss in this thread.

Thread head is quite long, so I’ll start with what is inside:

  1. Portfolio backtest results based on the ranking of all C2Star Program strategies.
  2. Portfolio backtest results solely based on strategies that passed the C2Star Certification (Gold Star)
  3. Smart Portfolio generation on the Paper Account for real-time testing, and results update before each rebalance.
  4. Data collection methodology.
  5. Excel file with various portfolio sizes results (top 2, top 3, top 5, etc.) for individual reading.

Smart portfolio based on the ranking of all strategies of C2Star Program.

I named this Rank method C2Star Only (Daniil version).

How the ranking works:
My formula is almost identical to the one written by Matthew, I just downgraded significance of the strategies with an age less than 60 days

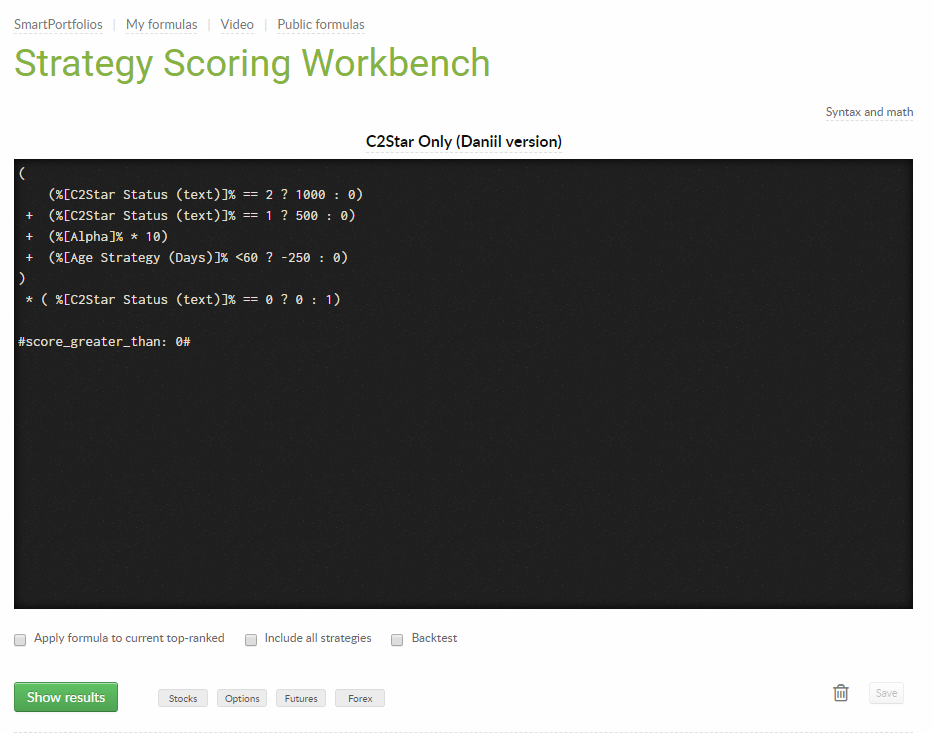
This formula selects strategies in the C2Star certification program.

Sort order:

  • first, full-certified (i.e. have met all criteria for sufficient time)
  • second, in the program but have not yet achieved full certification with the age over 60 days
  • third, new arrivals in the program (age less than 60 days)

Within these bands, strategies are ordered by Alpha (i.e. Alpha is the tie-breaker).

How the backtest works:

  1. Using the Scoring Workbench, I collect data of every 15 days and save it to a table. Data on the C2Star Program has been available since April 2019 (more in Data collection methodology section)
  2. I have made an Excel model to process this data, and it allows to:
  • compose a portfolio of a different number of strategies
  • set the model account size
  • display performance results for a given portfolio

I believe that regardless of the backtests results, the optimal size of a smart portfolio is 3-5 strategies. This gives a good balance between risk diversification and capital in use.

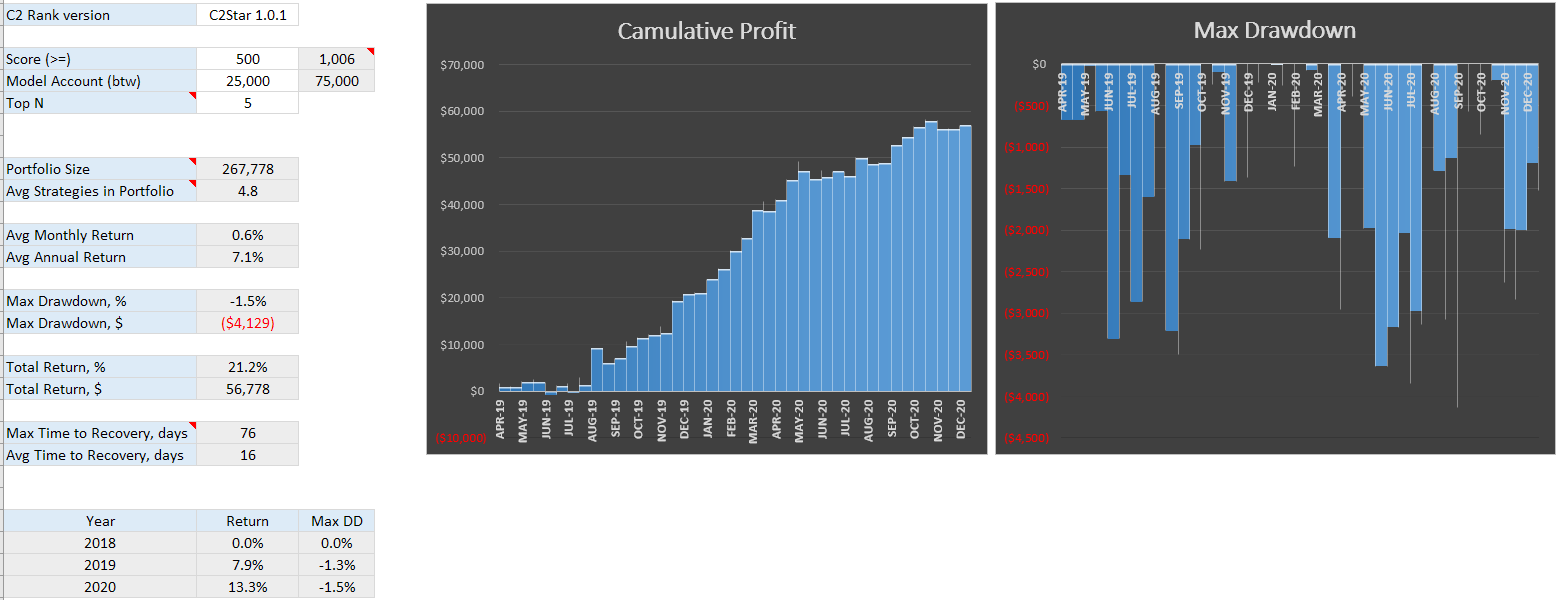
Smart Portfolio backtest of 5 strategies by C2Star Only (Daniil version) Ranking Method.

Smart Portfolio solely based on strategies that passed the C2Star certification conditions (Gold Star).

I named this Rank method C2Star Certificated Only by DaniilR.

How the ranking works:

  1. I take all strategies that have received Certified status in the C2Star Program.
  2. Sort by Alpha.

How the backtest works:

  1. Using the Scoring Workbench, I collect data of every 15 days and save it to a table. Data on the C2Star program has been available since April 2019.
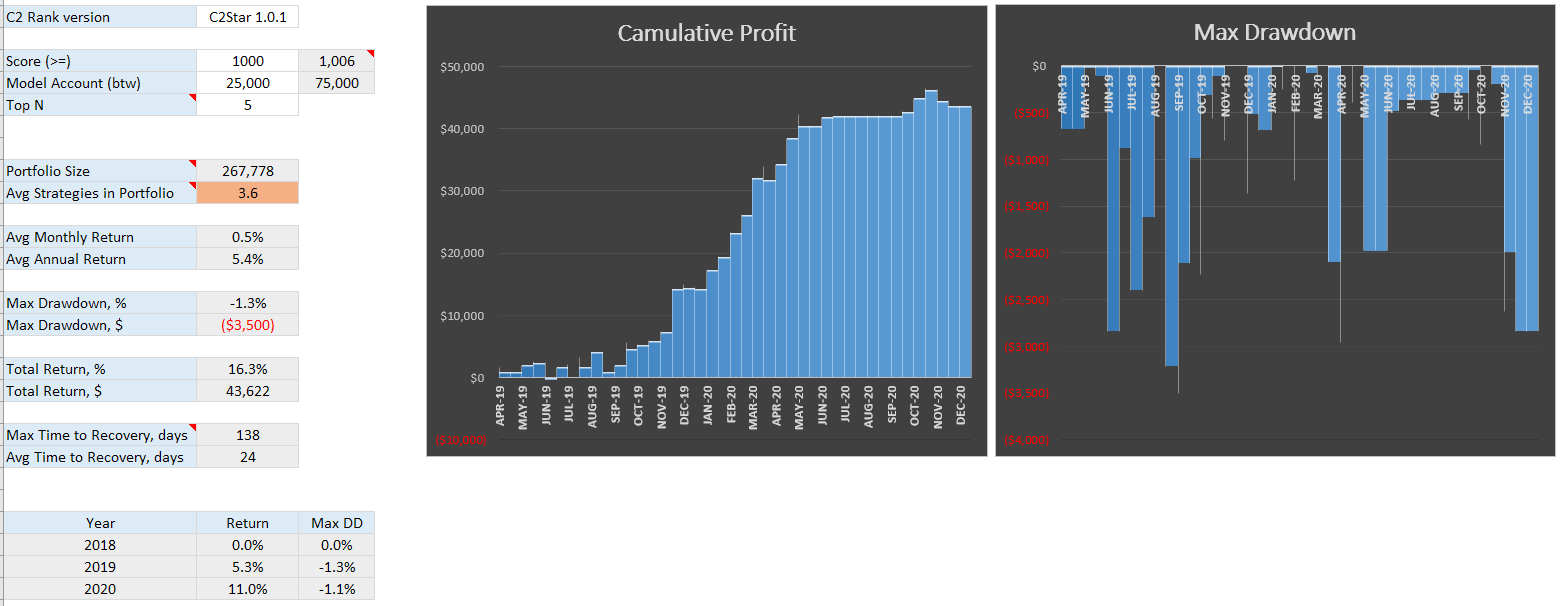
  2. In Excel model, it is necessary to set the Score (>=) value of 1000. This will mean that only strategies that have received Certified status are considered in the portfolio generation.

Smart Portfolio backtest of 5 strategies by C2Star Certificated Only Ranking Method.

Smart Portfolio generation on the Paper Account for real-time testing.

C2Star Certification is dependent more on the behavior of SP500, when it falls, we have 10 gold star strategies, when it grows fast – none.

But being within the Certification Program imposes certain risk management rules on strategies, which affects their stability.

Judging by the backtests results, it makes no sense to limit the portfolio generation to strategies with a gold star, but to use all strategies in the Program.

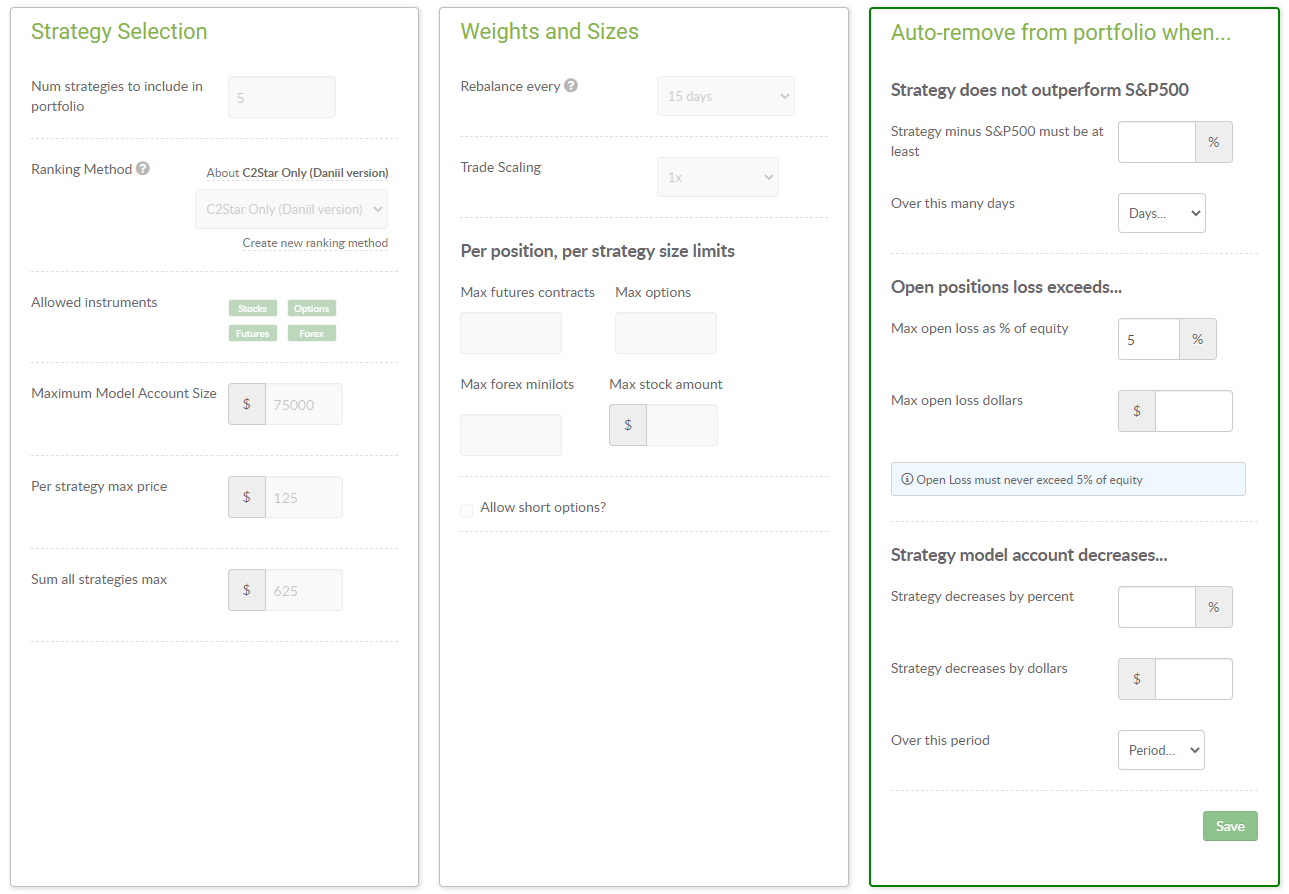
As the result, on January 25, 2021 I created a Smart Portfolio on C2 Paper Account using the C2Star Only (Daniil version) Ranking Method.

Data collection methodology.

For those who want to do smart portfolios backtests themselves, I will demonstrate the easiest way to collect data that does not require any skills or special software.
All you need is access to the Scoring Workbench.

  1. Collect data

  1. Insert data to excel model

  1. Now you can start reading the results of various portfolios

Value Score (>=) is:

250 - the portfolio can be formed from all strategies of the program, including with an age of less than 60 days.

500 - the portfolio can be formed from all strategies in the program with an age of 60 days or more.

1000 - the portfolio is formed from full-certificated strategies (gold star) only.

Excel File with C2Star Smart Portfolio Backtest

It doesn’t work correctly in Google Sheets, use Excel.

Further in this thread, I will publish the result of this Smart Portfolio every 15 days. Let’s check it in real time.
I will be glad to get your feedback, do not hesitate to ask any questions.

2 Likes

Thank you for this research @Daniil. This is an intriguing and worthwhile analysis and I am very interested to see how it progresses over time.

And all the best with your own C2Star system. I hope you can achieve consistent certification!

1 Like

Hello, Daniel.
Can I find somewhere a video guide with step-by-step instructions from logging to Collective2.com to getting back test result? What pages to open, what buttons to press?

Thank you for your work.

I think this is a very important enterprise.

I have 2 questions:

  1. Am I correct that the results you report above are only backtesting, that you haven’t yet taken C2Star certification or C2 rankings and seen how well rankings from period 1 affect returns and DDs in period 2?

  2. Am I correct that you plan to do such forward testing?

I would particularly like to see how C2 rankings perform going forward. The restrictions of C2Star are so strict that I don’t think that very many, if any, strategies can achieve this with actual trading (as opposed to hypothetical trading) across several bear/bull market cycles. Accordingly, I’m personally less interested in C2Star than in C2 rankings.

2 Likes

Thanks for your feedback!
I’m also very interested in what the result will be.
I plan to test other ranking methods as well, but they are not ready yet.

1 Like

Hi Andrii,
I tried to show it in Data collection methodology section.
If you have any difficulties, I will be happy to help.

Yes, that’s right

These are the results of the forward backtest (data collection every 15 days).
For the real-time test, I created a smart portfolio of 5 strategies and now I will publish its results every 15 days.

C2 ranking is not available on the workbench, so it is not possible to do a backtest yet.
As soon as the C2 ranking is available for testing or another rank method, I will definitely create a separate thread with backtest and real-time tests.

I’ll keep you informed.

Hot news: “Lucky” smart portfolio start.
One of the strategy exceed open loss limit: -$3254

So I’ve removed stop.

The requirement to be positively correlated with a rising S&P (and outperform by 1%) and to have a negative correlation in a down market (with a +1% record) is nearly impossible to achieve in the long term. That is why the C2 Star programs tend to be very short term traders. That works sometimes on hypothetical trades, but the reality of slippage kills the performance when there are subscribers.

This virtually eliminates traders of gold, crude and other commodities. Also bond and forex programs. Why benchmark to S&P? Shouldn’t the criteria just be risk adjusted profit?

1 Like

Hi,

To be absolutely precise, 0.6% per month, which is average annual return 7.2% (start date is Apr 2019).
Yes, it is less than SP500 in absolute values, but if you look at it from the point of view of the return on risk then:

SP500 from 2019 to 2020 reached + 44.65%, i.e. annual return of 22.32%.
Maximum drawdown -12.51% (March 2020)
Those. return/risk is 22.32/12.51 = 1.78

C2Star portfolio has:
Annual return 7.2%
Max drawdown 1.3%
Return risk is 7.2/1.3 = 5.53

But this is the past result. We do not know how it will be in the future, so I want to check.

I would also like to note that C2Star strategies often use low leverage, which makes it possible to scale.

Therefore, based on this backtest results, I believe that the C2Star program shows a good result at a distance.
I am currently working on a scoring method for a smart portfolio, and I can already say for sure that getting a good return to risk ratio is not easy. So far, the best ratio is 2.6 :confused:

2 Likes

The intraday DD for the SP500 was about 35% from Feb 2020 peak to March low, not 12.51%.

3 Likes

I took monthly data from S&P 500 Historical Rates (SPX) - Investing.com.
In addition, I see that I forgot to add the February 2020 result -8.41%. According to this data, it turns out -20.92%.
So they are not accurate.
Thanks for your remark!

Then it turns out like this:
By investing.com data the return/risk ratio is 22.32/20.92 = 1.07
By your data is 22.32/35 = 0.64

My rank method with 2.6 looks much better now :grinning:

1 Like

Are you using the intraday DD that C2 computes for its strategies. or are you computing your own monthly DDs for c2 strategies? Whatever you use should be the same for both the SP500 and the C2 strategies.

According to Yahoo Finance, the Feb 2020 intraday high for the SP500 was 3,393.52 and the March intraday low was 2,191.86. The DD was -35.41%.

1 Like

I count DD of strategies as difference between Model Account Size on start date and end date of test period (15 days). So actual DD can be bigger than in backtests, but soon Matthew will add actual drawdowns while test period and I’ll recalculate all data. Thus I will use the intraday DD that C2 computes.

I did not pay due attention SP500 DD; it did not figure in my research as an important indicator.
Thanks to @LiveForexSignals for bringing this up.

And you, @QuantitativeModels, for correcting me.

SmartPortfolio was rebalanced (15 days passed).
Now it includes

In the portfolio has changed one strategy, a new one is Singular 3E AI

P/L Report
Camulative Profit: -$496
Max Drawdown: -$3979

Compelling work @Daniil .

Maybe in the future your research could vary the criteria between asset classes in order to optimize your results.
For instance, while a drawdown of 20% in stocks is regarded as considerable and hard to recover from, a drawdown of 30% in Forex is acceptable and manageable. This, as you are aware, is notably due to the difference in liquidity and the nature of the participants in the two markets.
The concept of a Currency band changes the whole approach to risk, which you are currently considering from an equity standpoint mainly.

1 Like

Thanks @Had

This portfolio based on the strategies of C2Star program, so there are not enough strategies for dividing on different asset classes.

I am currently working on a rank method for all strategies.
At first it will be multi-market, but it can be by asset classes as well. But again, if the strategies will be enough.
Here is a sum of all C2 strategies by classes
image

As soon as the rank method is ready, I will create a forum thread for it and form a smart portfolio, and then can move on to the asset classes.

Theoretically, a multi-asset classes portfolio should be more stable due to better diversification, but this remains to be seen.

3 Likes

Thank you for the information. I definitely see your point about the number of strategies at hand and your all-encompassing rank method is a promising development.

1 Like

Are you referring to having the C2 score in Scoring Workbench? I have been looking for that also.

Daniil,

Thank you for doing this research it is very interesting. I look forward to following your results.

1 Like