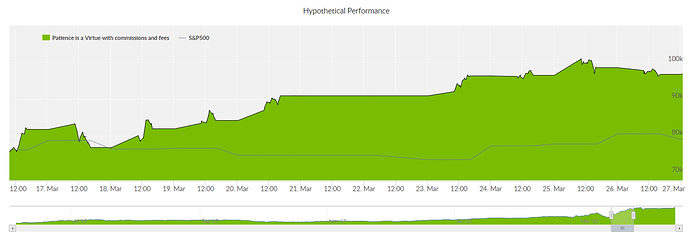
I will be the first to admit that I could be misunderstanding the C2 calculation, so I am looking for help understanding this.
Long story my ZIV trades from August 7th through March 23rd show a drawdown of nearly -18% which doesn’t make sense to me.
From August 7th all the way to February 24th I held at least 1 share of ZIV. From February 24th until March 19th I held 1 share of ZIV - less than 0.2% of my portfolio - while it dropped from about $70 to $31.36 at which point I bought 588 shares leaving me with 589 total with a cost basis very close to $31.36. One day later my indicators reversed and I sold 588 of my 589 shares for the price of $30.65 - a loss of about 2.3% of the position and much less of the overall portfolio. This left me with one share that I eventually sold three days later for $33.36. Now the low on the 20th of march was $30.17 as the screenshot shows. I do not understand how the drawdown as a % of equity shown is -17.95%. The drawdown listed is $15,307 which equated to about 17.95% of the total portfolio equity. However, I don’t understand how the cost basis needed to calculate a $15,307 loss from the worst ZIV price of $30.17 occurred.
FYI I was keeping 1 share of ZIV to keep trades private, but decided later that was unnecessary. Turns out had I kept that one share this metric would never have done what it did.
Here is a zoomed in equity curve for that timeframe too. There is a decent overall strategy drawdown before this timeframe but I only had 1 share of ZIV at the time and most of the drawdown was from TMF.
Yes, the price dropped 2.3% (it went from $31.36 to $30.65) but then you bought 588 shares, not one (1). The cost basis has very little to do here, because the number of shares bought from one price to the next is not the same, by a wide margin.
That could explain the drawdown you are talking about, if I am not mistaken.
Yes I bought 588 shares. If I said I bought 1 I misspoke. So one share was purchased at the $60 to $70 range and 588 were bought at $31.36. The price then dropped to the $30 range. It is all in the screen shot. I just dont understand how it adds up to a $15,000 drawdown. It could but I cant put pen to paper and make it add up because I am either wrong or it is wrong. If anyone can show me how the $15,307 drawdown was calculated it would be greatly appreciated. I am so far stumped, though I may dig into it more this weekend.
That’s odd, on 8/7/2019 your track record shows that you bought a total of 1,726 shares of ZIV, not 589 like you mentioned, is that correct?
By clicking this button that says Show AutoTrade Data shown in this screen shot it will expand trade history and show you the full details of each ZIV trade from 8/7/2019 until 3/23/2020, shown in second screen shot. It probably will make more sense if you look at both screenshots below in detail. It can explain better than I can. C2 I know merges all trades in and out into one set of 0 position to 0 position. Since I held 1 share or more for that whole period it treats it all as one trade. I am fine with that, but I don’t see when my ZIV position caused at 17.95% of account equity or $15,307 drawdown.
Below is a graph of my ZIV position compared to the ZIV price. As you can see I mostly bought in or sold out of ZIV at various times. I don’t see when there was a $15,307. The largest position I ever had in ZIV was about $18,000 and I never had more than about 1 share of ZIV while the price of ZIV dropped more than about 10% so how could I have a $15,307 drawdown.
@LiveForexSignals this graph may best show what I am trying to say. According to the data on the track record it shows that I had a $15,307 drawdown trading ZIV between 8/7/19 and 3/23/2020. However, when I take the detailed trades and use the daily prices of ZIV (I simpllified and just used the closing price) I show the below graph. I know C2 will take the daily low data, but even with that $15,307 doesn’t add up to me.
@EthosPortfolio I think this is the root of the problem with my AVG(MAE)/AVG(PL)-Loss score that you pointed out. C2 says the MAE on my ZIV trades from 8/7/2019-3/23/2020 was about $15,307 but by my calculations it seems like it should be only about $2,400 which bring my AVG(MAE)/AVG(PL)-Loss score within a reasonable range, assuming I am not missing something. Thank you again for putting me on the right path in that other thread.


The other thread: Patience is a Virtue: Not Showing On TOS Board
1 Like
Let me see if I can kick one of the servers in the back room to fix this single-trade-drawdown stat for you.
You are the man @MatthewKlein. Thank you for your help! In the end this was a good thing because it really made me better understand the C2 ranking system.
While C2 metrics are important, I have noticed over and over again that they do not matter that much as far as subscriptions are concerned. There are C2 systems with 80, 90 or 100% drawdown that still attract subscribers. But there are also C2 strategies with extremely small drawdown and excellent return on investment that get little or no attention at all. Go figure why.
Anyway.
2 Likes


