C2 Systems such as GALEFORCE, HYPERSTATE incorporate multiple time-frames for trading decisions but never a really higher time-frame such as the Daily or Weekly charts. However some of the underlying algorithms can be applied to say Daily Charts to obtain a pulse on where things stand or may evolve from a big picture point of view spanning multiple months or years in advance potentially.
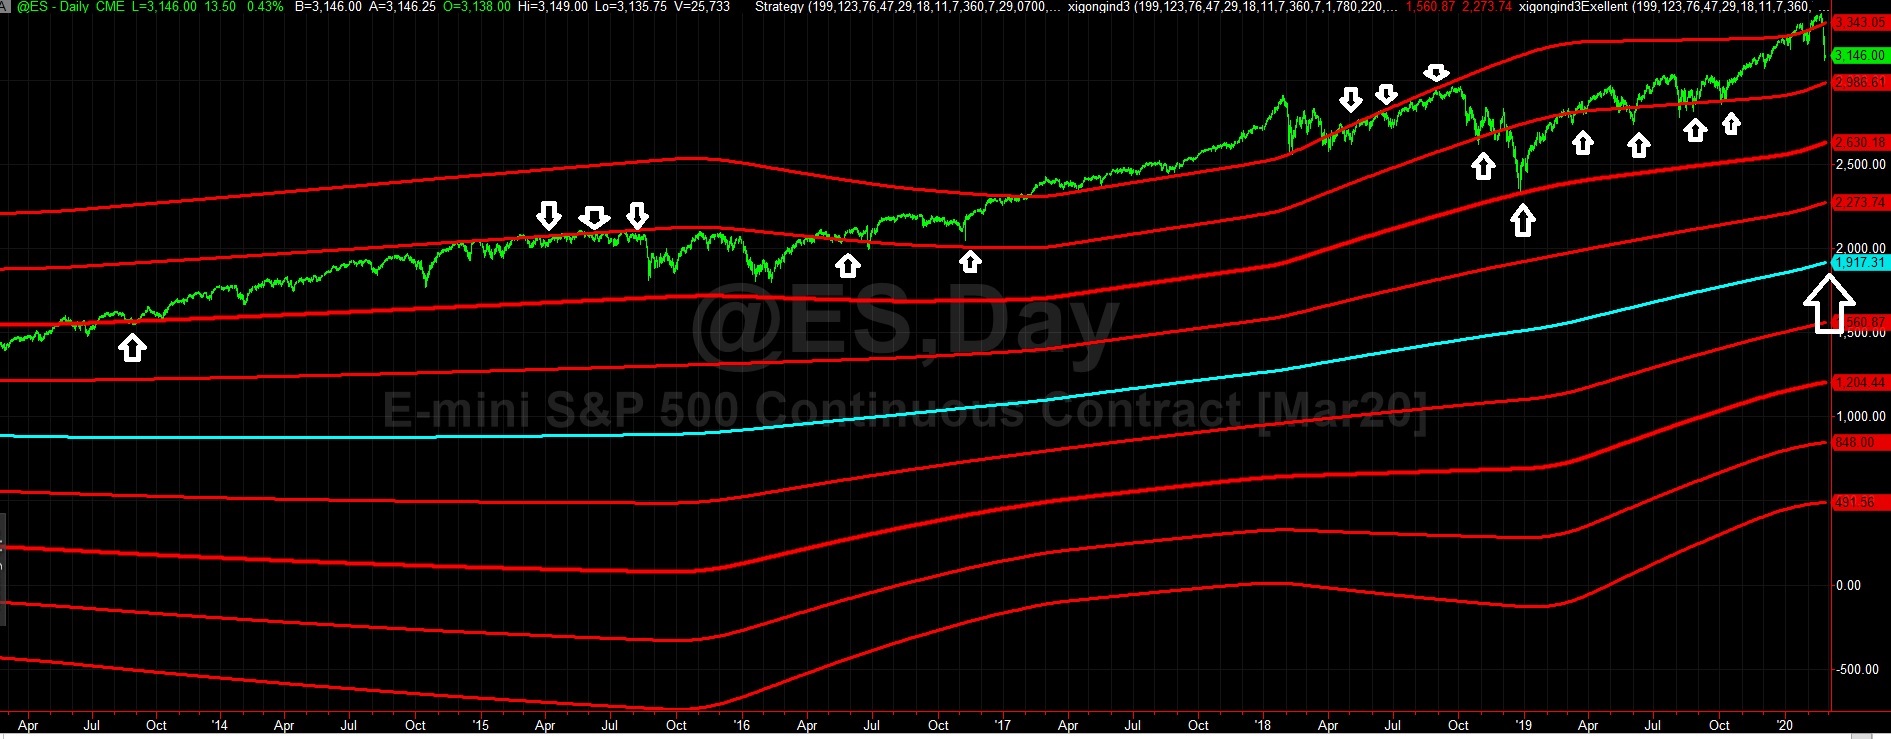
In the below S&P (ES) Chart (proprietary indicators) there is one central (cyan) line that is in essence the fulcrum for the S&P (ES) market, one discovery about markets using this indicator is markets oscillate up and down through all these lines with the central cyan line acting as sort a mean value that attracts price back towards it especially whenever the market travels to the extreme outer lines. The extreme range stands between 3343 (top) down to 491 (bottom-most line) at the moment (02/25/2020)
As of 02/25/2020 S&P (ES) is near the extreme upper outer line (3343) just breaking down below it, the next line is at 2986 is a good exit target area for folks who managed to be Short around 3350 A worst case scenario over the next 6-12-24 month time-frame is continued breakdowns at the key lines 2986, 2630, 2273 towards that central cyan mean value of 1917
For someone bullish minded instead of buy now, waiting for a rebound that exceeds 3343 (top most line) would be smart or could try a rebound play at 2986 area.
Trading involves Risk. No representation is being made that any account will or is likely to achieve profits or losses similar to those that may be shown. Past performance is not indicative of future results. Individual results vary and no representation is made that clients will or are likely to achieve profits or incur losses comparable to those that may be shown.
