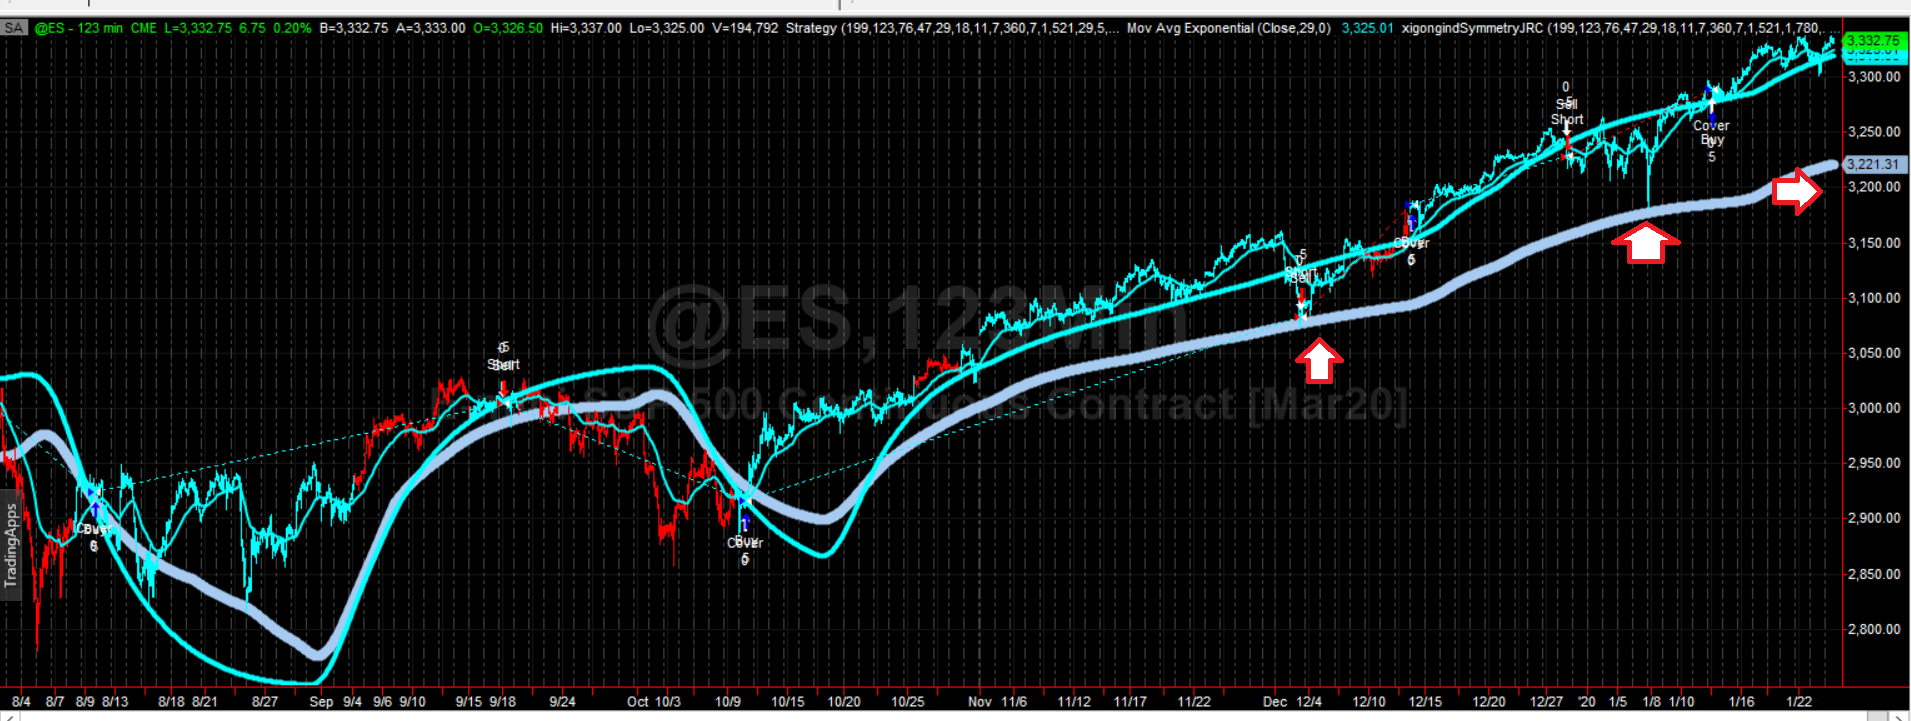
Trading often involves considering multiple time-frames, and one relatively higher time frame chart (2 hour) used for C2 systems GALEFORCE and HYPERSTATE below chart image (proprietary indicators) The idea is that if ES breaks below 3300 next stop 3200 or thereabouts may not necessarily be a straight line drop the key concept is it would travel below the gray bottom line (The previous two attempts the gray line acted as support but the pattern is to break below it becomes higher probability when it has previously acted as support) (To be noted neither system would be directly trading this setup were it to obtain but the scenario serves as an input to a more complex underlying algorithm)
Trading involves Risk. No representation is being made that any account will or is likely to achieve profits or losses similar to those that may be shown. Past performance is not indicative of future results. Individual results vary and no representation is made that clients will or are likely to achieve profits or incur losses comparable to those that may be shown.
