Will trade e-micro sp500 futures .
Minimum Capital 10K dollars .
Strategy will be based on bid/ask analysis .

Welcome @SeanJa, in the future you should post your strategy name and other info that may help describe the strategy.
The link:

Lol @SeanJ…I doubt that means anything to most people. Care to elaborate?

Some selling at the highs …


Can you explain what this tables mean?
The strategy trade leader does not seem to answer your questions.
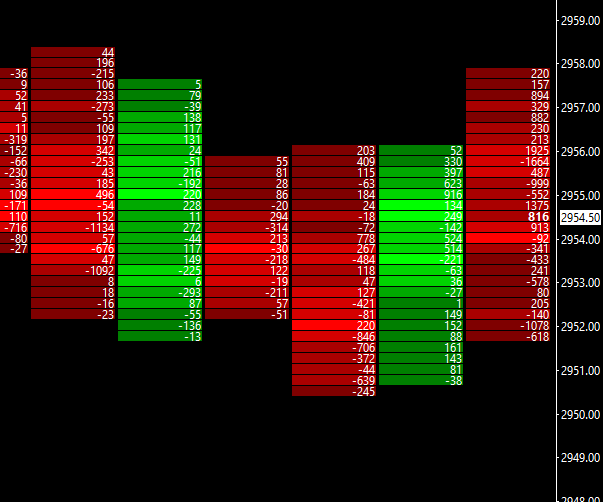
It seems to me that the screenshots show bid(red-sell) and ask(green-buy) number of contracts traded on ES and right hand side shows ES futures price.
You cannot make money solely based on these data in the long term.
I hope this helps.
Some of the charts have multiple red columns. Also, I don’t understand what the negative numbers are supposed to mean compared to the positive numbers.
Now the big question is will this also collapse, as witnessed with the other recently listed day trading futures systems with live subs…also concerned the R:R seems a bit high…
Good points. I have no idea. The minus sign could mean that the number of contracts traded are changing and are still printing, at least this is my experience with some futures data providers.
These numbers represent the differential between ask volume and bid volume at a given price at a certain time frame .
More sells then the number will be negative .
These red and green candles are price candles . The latest picture is for 5 minutes candles , the rest are for hourly candles .
So negative number = more sells .
Positive number= more buys .
1 Like

can you advise which software you are using for this, it looks interesting (intricate volume data). One indicator alone is limited, but this could be added to complement/synergize additional confirmatory indicators.

@SeanJ it would be more valuable if you actually commented on what you are showing because I am pretty sure 99% of the people here don’t know how to interpret what you have shown.
Most trade leaders would actually make a comment. For example its a sideways morning with buying and selling occurring throughout the morning as represented by the down red bars and up green bars (thats how I am interpreting the images…lol).

@SeanJ, again great picture…but what is your intepretation of the snapshot you have taken? lol…
Do you actually know what it means yourself since keep posting these images without any explanations.
