DETAILED BACKTEST RESULTS
I hope you are all well and about to have a great Easter weekend. Today, I wanted to take a little time to give a more detailed look at my backtests. You must realize that these are just estimates of hypothetical performance and not guaranteed to be correct. My main reason for doing this is to show you that my performance will not always be as good as it is at this moment. There are major risks to investing the way I do. I likely have not done my backtests with perfect accuracy. There may be some major problems I am missing. I do feel very confident that my strategy at some point in the future will have a drawdown much greater than has today and likely larger than any of the backtests show because the past is not a guarantee of the future. Bottom line invest at your own risk! I am investing my own money at my own risk.
New Backtests
It is difficult to know if a system will perform in the future like backtests showed in the past. There is no way to guarantee the future. However, it is possible to test the quality of the backtesting methods to a degree by trading with real money for a period and then applying the exact same backtesting methods to that period. By comparing the results, it can help show if the backtesting methods seem to even reflect reality.
I started trading live with a significant portion of money on June 4th, 2019 through April 1st, 2020. Last weekend I also performed backtests for that period to compare the backtests to the actual results. The results were very similar and make me believe that for the most part my backtesting methods do provide a good general idea of how my strategy would have performed in different periods in the past.
There are of course many limitation to my backtesting the further back in time I go because not all the data for those periods are availablse and some of the assets I trade didn’t even exist back then. But I have done my best to work around those. The results assume I did not speculate on Bitcoin until GBTC was publicly traded.
Below is a summary comparing the hypothetical C2 results vs my backtest results:


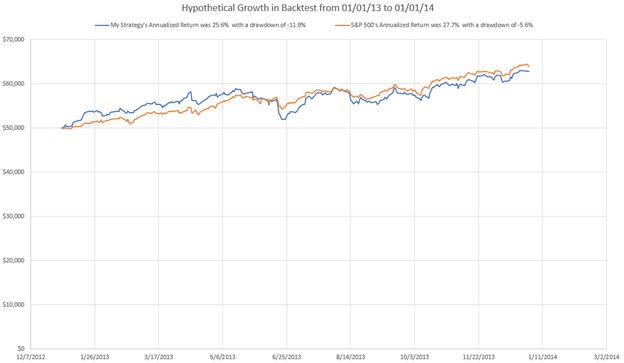
Longer Term Backtests
In my mind the effectiveness of my backtesting is confirmed though as always there are still big risks and uncertainties. Now more than ever I believe my backtesting methods seem to be able to mimic history. My test seem to show that:
- Some years it shows results worse than the S&P 500.
- Some years it shows negative or flat results
- Down years in the market seem to be good for my system.
- The system does best in trending markets.
- Really good years and really bad years for the strategy can occur in any order.
I am using the following graphs to give myself an idea of the good, the bad, and the ugly I need to be able to stomach when trading my strategy. I believe consistency is key for any subscriber to have a chance of mimicking my strategy well.
Have a good Easter and enjoy the graphs below!
Interactive Assets


YTD

Full Time Frame

