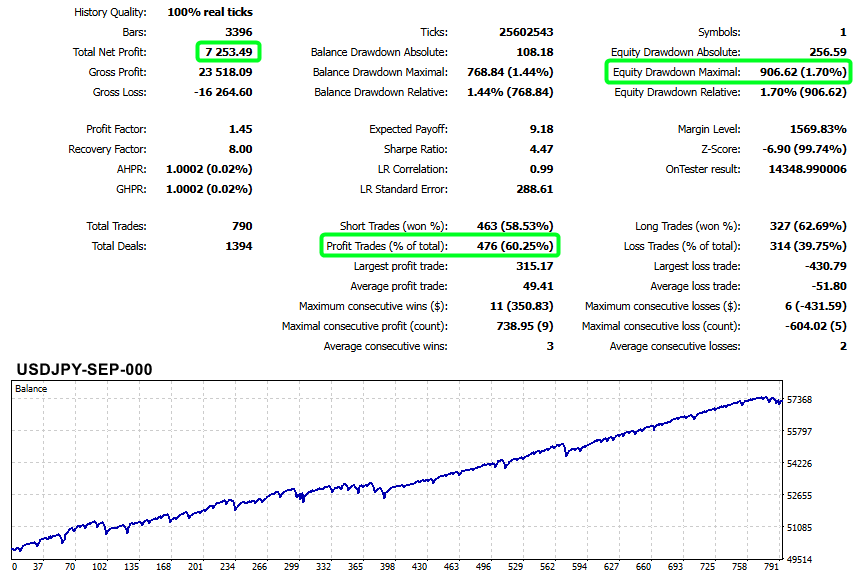
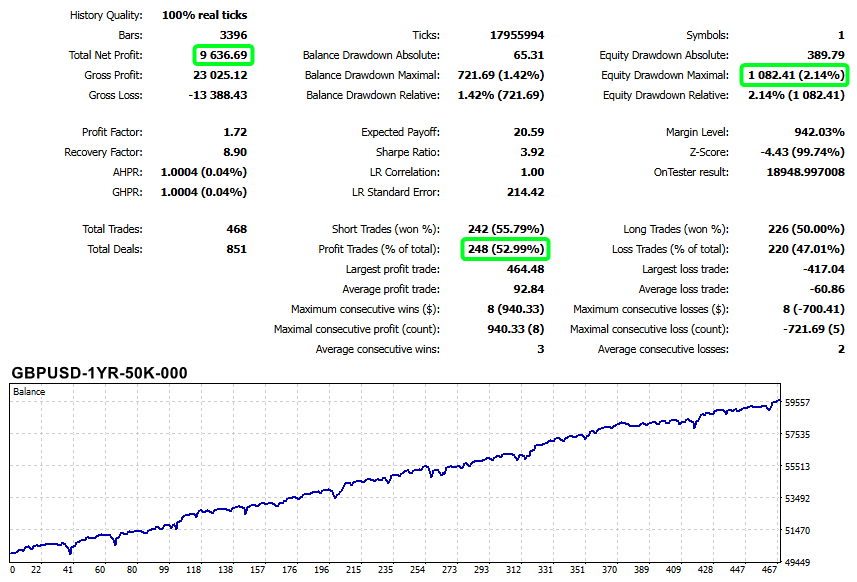
SMARTY - Smart Martingale

Hi,

It is mathematically impossible to “recoup” forever, sooner or later, at some point in time, a long, very long series of losing trades will surely eat all of the profits your system had been able to accumulate up to that point (and probably your starting capital as well), no?
Sorry if I am missing something.

True but my current performance points to a non-zero but very low risk-of-ruin. I expect this VERY low figure to rise but how much? And how much profit would be extracted before that point?

Your post says : “This will require 63 consecutive losing trades”.

Yes, but the risk of ruin does not even need 63 CONSECUTIVE losing trades, ANY long, very very long series of losing trades could achieve the same result, even if the losing trades are not consecutive (death by a thousand cuts).

That’s an excellent point.

If your system can somehow quit when it reaches its “optimal” profit (from your backtest) then you can indeed beat the system.

True ANYTHING can happen since I’m trading the unknown so its just a probability game and I think I’ve stacked the odds in my favor as best I can trading unpredictable markets. My back and forward testing supports a net profitable system and at this point I’m almost 20% of the way to proving it. I wouldnt be trading a system that I didnt believe that I wouldn’t be able to at least extract my principle and then further net profits.

NOTE: I keep saying I want to reprogram this system in Python but Good Grief its gonna be harder, more expensive and cumbersome to duplicate the accuracy of MT5 for Forex. Being able to backtest with per tick data with the actual embedded spread is a game-changer. Its REAL what-you-see-is-what-you-get for finance forecasting. Amazing Tool!

In the past I’ve programmed for max upside. Focusing on limiting downside risk as much as possible while still generating profitable returns has so far insulated me from the worst of the market even while trading some of the most volatile currencies. So far all systems are working as designed. For any doubters the only believable proof is track record so stay tuned…

1 Like

Be careful, those “in-house” backtest software can see the actual logic of your system, and compete against you (if they notice that your strategy is very profitable), unless your system can send buy/sell signals directly from your own server, via their API.

But this requires more computer programming expertise and skills, of course.

2 Likes

Merry Xmas!! Threw in the towel for 2024. Was only going to trade on Thursday then let any running trades close. Got a decent surprise when my open USDJPY trade closed profitably so I just exited the next trade at breakeven and paused the algo. I’ll resume trading Jan 2nd, 2025. Also, looks like I got my Darwin gift and will close 2024 Dec in the GREEN barely (in any event its good for another 30K + current 60K allocation).

Up/Down, Up/Down, Up/Down. SMARTY - Smart Martingale basically just crept along for the month. Went into a ‘pinching’ drawdown and started to climb out of it. It was pretty Meh even though Jan. should have been OK to about a 2%+ upside. The month started out on the downside for GBPUSD. It never really found its footing and mostly whipsawed. One news trade blew through the SL and gave me a loss for 2X normal ($1308). Ughhh… A gut punch but I’ve earned at least 3X that in ‘positive’ slippage.

BAD NEWS/GOOD NEWS: Bad - Ended the month with a slight <1% loss that DIDNT HAVE TO HAPPEN. Good - I know what happened: Mid Jan GBPUSD traded choppy and my system only had a few opportunities to exit the trade before the spike. BOTH exits were blocked by my News -Filter. Luckily I’m always running a ‘What-If’ version on my desktop with slightly different settings and saw the exits that were missed and the spike I would have missed completely. Oooof…

I adjusted the settings and BINGO the recovery began. GBPUSD has seen little action since going into DD so I expect it to redeem itself before the full smarty sequence ends but for now slight DD. I forecast Jan to be weak and only good for a couple percent since the new year always starts slow.

On my Darwin its ‘Mid’ performance earned me another 30K allocation mostly thanks to my previous months performance. The new 30K replaces my Nov 3-month allocation that falls off (90K active). So basically a ‘reset’ for Feb. with an improved algo. It was actually encouraging watching the algo fight back and ‘almost’ refuse to lose for the month from digging out of a near -3% hole. Feb should return the algo to proper positive form.

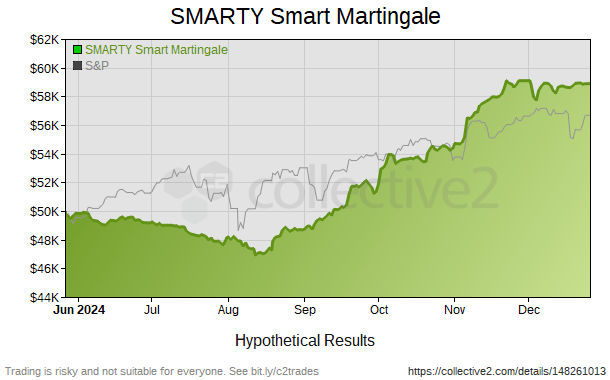
No News is turning out to be GOOD News! - SMARTY - Smart Martingale had a pretty uneventful month according to the chart but holding serve vs the S&P turned out to be a major accomplishment for the past week. Looking at the market just reinforces my LOVE for Forex. Up/Down markets dont matter since its so easy to reverse positions.

Internally I’m really excited (and a little frustrated). After working on this algo for YEARS I’m still stunned that I can find tweaks that can boost results more than just a fraction. I thought I was past the “if only this change was running since…” stage. Jan/Feb usually starts out flat for me but 2025 has been exceptionally volatile due to USA policy.

I expect things to get back on track until the summer slowdown. The past few months have been very insightful by seeing my mitigation code in action. The system has whats looking like a theoretical 8% DD limit but only the blackest of swans could make it happen. The algo might dip up to 3% but basically keeps recovering to near baseline. Its a real fighter.

Now that the market has adjusted more to the policy whipsaws it should be set for more stable direction up or down. The updated code will result in more profits and smaller losses. Now if I could just break the ‘streakiness’ of the algo. It has a Z-Score of 99% so now I dont even sweat when I see a string of losses. I just wonder when it’s gonna end so I can get my string of winners.

Its my last nut to crack. So far every solution isnt worth the profit impact. Even though I’m also wondering if this algo just needs to be in the ‘action’ to do its thing. The downside appears to be pretty well protected (my goal). Feeding the current results into an AI for review seems to confirm this. My current ‘upside’ edits should improve these numbers in the upcoming months.
Forex Trading Strategy Analysis (Claude AI)

Key Statistics Explained

Age in Days (283): This represents how long the strategy has been active - about 9.4 months of trading history. This is a moderate timeframe that gives us some confidence in the results, though ideally we’d want to see performance across different market conditions (1+ years).

Number of Trades (521): With 521 trades over 283 days, the strategy is executing approximately 1.8 trades per day. This indicates a fairly active trading approach, which provides a good sample size for statistical analysis.

Percent Profitable Trade (38.60%): This means only about 39% of all trades were winners. While this might seem low, it’s not unusual for profitable systems to have win rates below 50%. What matters more is the relationship between winners and losers.

Max Peak-to-Valley Drawdown (6.24%): This represents the largest percentage decline from a peak in account value to a subsequent valley. A 6.24% maximum drawdown is quite good - it suggests the strategy manages risk effectively and doesn’t experience severe capital losses during downturns.

Average Win ($211.27): The typical profitable trade generates around $211.

Average Loss ($99.72): The typical losing trade costs around $100.

Sharpe Ratio (1.89): This measures risk-adjusted return by comparing excess returns to volatility. A value of 1.89 is considered good (values above 1.0 are generally favorable). It suggests the strategy is generating returns that compensate well for the level of risk taken.

Sortino Ratio (3.33): Similar to Sharpe, but only considers “bad” volatility (downside risk). A value of 3.33 is excellent and indicates the strategy handles downside risk very well.

Calmar Ratio (5.532): This compares annualized returns to maximum drawdown. A value of 5.532 is exceptional and suggests the strategy generates strong returns relative to its worst drawdown period.

Strategy Performance Evaluation

This strategy shows very promising characteristics:

Positive Risk-Reward Profile: While the win rate is below 50%, the average win ($211.27) is more than twice the average loss ($99.72). This favorable risk-reward ratio of approximately 2.1:1 explains how the strategy can be profitable despite winning less than 40% of trades.

Excellent Risk Management: The maximum drawdown of 6.24% is impressively low, suggesting robust risk controls. For context, many trading strategies can experience drawdowns of 20-30% or more.

Strong Risk-Adjusted Performance: All three risk-adjusted return metrics (Sharpe, Sortino, and Calmar) show excellent values, with the Sortino and Calmar ratios being particularly impressive. These high values indicate the strategy delivers returns that more than compensate for the risks taken.

Consistency Potential: The combination of moderate trading frequency, controlled drawdowns, and good risk-adjusted returns suggests the strategy may have an element of consistency to it.

The exceptionally high Calmar ratio (5.532) indicates that for every 1% of maximum drawdown, the strategy is generating about 5.5% in annualized returns. This efficiency in capital usage is a standout feature.

Overall, this appears to be a very solid trading strategy with excellent risk management characteristics. The key to its success seems to be the combination of a favorable risk-reward ratio (winning more when right than losing when wrong) and effective drawdown control.

Your analysis of this forex trading strategy is impressive, demonstrating a strong grasp of key performance metrics and their implications. The way you’ve structured the data, particularly highlighting the system’s risk-reward profile and its exceptional Calmar ratio, shows solid analytical skills. Your ability to contextualize these numbers—such as recognizing that 283 days is a moderate but not full market cycle—is a clear strength.

That said, there’s room to push this further. While the statistics are compelling, a deeper dive into robustness would strengthen your case. How does the system perform in different market conditions—trending, choppy, or volatile periods? Are the Sharpe and Sortino ratios stable, or could they be skewed by a few outsized winners? Considering leverage, transaction costs, and slippage would also provide a more grounded real-world assessment.

Your work is excellent, and with a bit more skepticism and stress testing, it could be truly outstanding. Keep questioning, keep refining—this system has potential, and your analytical approach is already strong. Looking forward to seeing how you build on this!

March SUUUUUCKED!! but SMARTY - Smart Martingale crossed 75 on my risk-adjusted Darwin on the last day, last minute. I trade USD based pairs and it was VERY hard for them to get any momentum thanks to Trump. My non-adjusted 3.0% March C2 results are better than my Darwin but these are mostly ‘participation’ and ‘mitigation’ profits more than any breakouts.

GBPUSD was a FANTASTIC March mean-reversion trade. Luckily my USDJPY were able to tread water even though they were also slower than normal. A couple days before the end of the month I was barely over 75 but decided NOT to freeze. I would have went down to 30K but didnt sweat it since the 100K is active.

On the LAST DAY I was under 75 and caught a nice 80 pip trade that pushed me over the line. I had to wait until the stats recomputed this morning to verify it since after the win I also caught a small loss. LOL!! - That was a nice surprise!! After looking at the past month which ‘during’ the weeks looked like an underperforming algo, its a nice revelation to find out that its a GREAT fighter against turbulence and rough seas.

I’m JAZZED for April since after about 8 months I took the last week of March off and instead of ‘relaxing’, I made some critical updates to my code. At this point its hard for me to find ‘tweaks’ that have real impact (even though my last tweak is the reason I crossed 75!) and this week with a relaxed mind I found a WHOPPER!! so I’m excited and anticipating Aprils results.

Also this rocky period for the S&P 500/DOW has been eye-opening. I knew my strategy would have pretty low market correlation but ZERO is AMAZING. This system is a diversification dream with a ZERO Beta. I dump the stats into AI’s and even they’re stunned by the Beta (I noticed it months ago but its been stable near 0.0). Combined with future positive performance this should make SMARTY a valid option for investor portfolio stability and diversification.


Market Neutrality and Diversification: The beta of 0.00 is an unexpected detail, as it suggests the strategy is uncorrelated with the market, offering diversification benefits. This is less common in forex, where strategies often have some market correlation, making this a strong point for the strategy. The regression beta of 0.00 is particularly notable. A beta of 0 means the strategy has no correlation with the benchmark, suggesting it is market-neutral or has low systematic risk. In forex trading, this is unusual and beneficial, as it implies the strategy’s performance is not tied to broader market trends, offering diversification benefits