SP 500 Futures Scalper 2024 - New ATH and 50% off

The previous thread for this strategy is here.

50% off first three billing cycles coupon (good through end of Feb): UGBD28459

And as always, ANY CALENDAR MONTH THIS STRATEGY DOES NOT RETURN POSITIVE ROI (as reported by C2) CURRENT SUBSCRIBERS WILL GET THEIR NEXT MONTH FREE.


Like the S&P 500, SP 500 Futures Scalper closed at a new all time high yesterday, more than recouping the losses suffered in September and October.

For anyone not following along over the last few months, I technically started this portfolio of strategies on C2 at the end of January 2023, spent February working out some “nuances” with C2’s BrokerTransmit system to broadcast live trades, and really got going in March 2023.

We were green every month from March through August, but we took a hit in September and October (along with the rest of the market). On the backend, we realized that our strategies, which are automatically tuned over every weekend, became “over-tuned”, or overly biased toward opening and holding long positions, since that was paying off for the first few months it ran. However, when the market jumped off a cliff in September, that long bias ate our lunch.

We spent most of October retooling our strategy selection and tuning process, and made a number of important changes, including significantly tightening our stop loss and take profit calculations, and splitting out our strategies into “long only” and “short only” strategies, reducing the impact of a sharp market reversal against our net open position.

The goal of these changes was to “even out” the roller coaster a bit, tempering both the potential downside AND upside, targeting a consistent positive monthly (or at least quarterly) return with less correlation to market behavior, rather than our ROI basically just magnifying the current market direction.

Since “re-launching” in November, while positive every month, we actually slightly trailed the insane end-of-year bull run when the market bounced back from the Sept/Oct pullback. And we’re OK with that, because what we saw was exactly what we hoped: we took measured profits in good market weeks, and either added profits or minimized losses in red market weeks.


About the strategy:

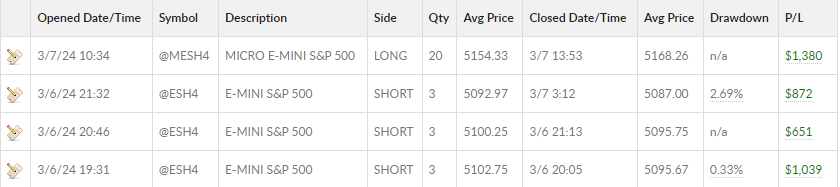
SP 500 Futures Scalper opens long and short positions in futures markets trading S&P 500 E-Mini and Micro E-Mini futures contracts. It is designed for account balances of at least USD$60,000. The maximum position is three E-Mini contracts (or thirty Micro E-Mini contracts).

  • I trade this strategy live in my own Interactive Brokers account. Every trade is posted using C2 BrokerTransmit, and is a trade I have executed. What you trade, I trade.

  • On the backend, this strategy is actually a collection of independent “long only” and “short only” strategies. So C2’s BrokerTransmit system does not break, long positions trade Micro E-Mini contracts, and short positions trade E-Mini contracts.

  • This strategy is AI generated and tuned weekly (over the weekend).

  • This strategy is 100% automated and run 24x5. I NEVER place a manual order, or override an automated order.

  • My tuning and trading servers are beefy dedicated physical servers (not virtual machines) sitting in a data center in New Jersey with <2ms latency to Interactive Brokers. I’m not running this out of my basement or off of my laptop.

  • Collective2 is not my full-time gig, but automated algorithmic trading has been my full-time gig for the last six years.

This strategy was generated using genetic algorithm AI and opens a position only when a convergence of technical indicator values result in an acceptable trade setup, and then calculates aggressive take profit exits, ideal for volatile markets with frequent sentiment-driven intraday reversals that destroy most day-trading strategies. The manager has traded this strategy live since May 2022 with their own funds through their broker.

ALL RECORDED TRADES IN TRADE RECORD ARE LIVE TRADES IN THE MANAGER’S OWN ACCOUNT. In other words, I’m trading MY money with this strategy, not just yours. C2 trade signals are generated by mirroring the trades in my live Interactive Brokers account.

2 Likes

So, we have logic that basically says once the market trends a certain amount in one direction in a day, don’t open a position in that direction past that value. For example, those values are currently set to -1.9% for a short position. In other words, if the market is down over 1.9% for the day, do NOT open a short position.

That logic did NOT function as expected today. We closed a second short position in profit at about 3:26pm when the market was -2.08% for the day. The portfolio then immediately opened up a subsequent short position at 3:27pm, which we are now being killed by, down 4% since 3:27pm after being up over 1% for the day.

Obviously, we will be looking at that ASAP to see why that logic failed. It is a costly error today, going from up 1% to down 4% (so far) for the day.

image

To make matters worse, the stop loss value calculation is impacted by the day’s volatility, and as we had a GIANT move in the market today, our stop loss value is proportionately larger than usual (around 5000 I think).

I can not watch every trade live (though I do watch a lot of them), hence the automation. When I had last checked on everything a little after 3PM EST, I saw we were up a bit. When I next checked on everything a little before 4PM, I saw the catastrophic open red short, and quickly determined that short should not have happened as the market was past the threshold for which that short should not have been allowed by our logic. But by that time the damage had been done.

Blocking opening a position past a certain daily market performance value is new logic implemented in early December, and was of course tested at the time, but I’m not sure it’s ever had the opportunity to run live until today. Obviously it did not function as it was supposed to. That, combined with the typical meteoric bounce/reversal at the end of the day and a larger-than-usual stop loss value, was the perfect recipe for getting killed.

That short is still open, should never have happened, and is far and away our worst single trade since retooling everything in October/November. On my end it is staying open. It may very well stop out on its own overnight tonight.

Well, I hate that we had a long position stop out after the hawkish Fed Reserve minutes release at 2PM dragged the S&P down even further, and right before the end-of-day pre nVidia earnings call FOMO kicked in like clockwork, but we’re still up well over 1% in a very tumultuous trading day thanks to several profitable short trades…

Well, the near all-time-high market has not done us any favors this week, in a coma as traders sit nervously on the sidelines while economic data rolls in, the most significant (so far) being this morning’s core personal consumption expenditures price index (the Federal Reserve’s preferred gauge of underlying inflation) rising in January at the fastest pace in nearly a year.

Our strategies need price movement EITHER direction to profitably trade, but with the S&P 500 trading all week in a flat 0.5% range, our tight stop losses are being triggered more than our take profit targets as the market repeatedly fails to break out in any direction.

Barring any new trades this afternoon, it looks like we’ll finish February down around 5%, bringing our 2024 YTD to about 10% ROI, which is still spot on our goal of 3-6%/month ROI on average. We should actually be at about 15% ROI YTD, but we had the previously mentioned glitch in a new feature that went live in December (since corrected of course), which permitted our worst trade of February that should never have happened.

image

I really hate watching days like today, where the market has been DEAD flat in a 0.25% sideways range since opening last night, only to dupe our strats into going long with a small burst of bull enthusiasm, and then get stopped out in a kneejerk reversal in the final minutes of the trading day.

We have looked at a lot of ideas around this, but have yet to figure out logic to mitigate this scenario (that does not do more harm than good in backtesting).

And THIS is the perfect example of a data release driven kneejerk barely stopping us out before snapping back. Worst scenario I have to watch is when this happens… :rage:

A good day for the S&P, up just over 1% currently, and a good day for us… After five consecutive losing trades to start the week, we just triggered a rarely triggered portfolio event: stopping trading for the day once our ROI for the day exceeds 5%…

image

As you can see on this 4-hour chart, the market has not done us any favors this month, trading sideways in a <1% range the entire month (other than when it jumped on Thursday March 7th, when we made almost 5% ROI in one day) with very low intraday price movement. Only thanks to that Thursday, the S&P is BARELY up for the month.

Looking at our March trade analysis to date, we’re up almost 5% on short trades, and down right about 5% on long trades, netting us a hair below break even currently… our short strats seems to do OK in a flat/sideways market (a bit more discerning I think, which makes sense given the market as a whole has been going up for most of the past 15 months), but our long strats take a beating…

If you’re wondering “why don’t we just pause/reduce entering long positions when the market is sideways?” it is because, by the time you’ve “confirmed” a sideways trend to pause/reduce trading, you’ve already been in it for a while (probably racking up a few losing trades), and then by the time you confirm that you’re NOT in that sideways channel anymore, you’ve already been out of it for a while and likely missed out on a few winning trades.

In backtesting for our strats, reducing trading when we’re trying to identify a sideways market always nets lower ROI and higher MaxDD/ROI over time. So, we try to tread water through the flat weeks, and net positive ROI when the market starts moving again.

Hopefully after we get past tomorrow’s “triple witching day” (the third Friday of March, June, September, and December when stock index futures, stock index options, and options on stock index futures ALL expire) the market will pick a direction, EITHER direction.

Hello Chris, I hate to see anyone talk to themselves so much, so I’ll share a thought I had. One of my mentors taught me to “trade the market I have, not the market I want”. I found that useful… if the market is trending in a direction unfavorable to the way I’m setting my trades, it’s ME doing something wrong, not the market. The market does what it wants to, caring naught for my opinion about it, so I listen to the market. In this case, your trades need Mr. Market to have more volatility, but vol is low and dropping, so maybe you should… nope, I’ll stop there, not giving anyone advice like that. May the odds be ever in your favor.

1 Like

Thanks, wise words!

Our strats DO actually adjust to volatility changes (among other things), but most of our strats are tuned on multiple timeframes going back up about three years, so any changes to the strats typically require a sustained change over a longer timeframe. As I’m sure you know, if we tune for every last bad day/week, all we’ll do is be rich in backtesting and overtune for the future.

What we observed (in my real job, not here on C2) is that our models can take upwards of a couple of months to be totally dialed in to a new overall market direction. An example I went through was the market going straight down through Sept 2022, at which time we were doing really well mostly shorting the market. When the market rebounded starting in October, we were not profitable again until December. But then, we were profitable every month from Dec 2022 though Aug 2023. Then the market pulled back in mid-Aug 2023 through mid-Oct after going straight up for the previous 7+ months, so we lost money those months. And then, after 2+ months straight down, the market then rebounded like a rocket in November, so we lagged that recovery (though were still profitable).

All that to say, we do very well over time (in real job 60% ROI in 2022 and 64% in 2023), but it requires weathering flat/indecisive market periods (where we are now, bouncing off all-time-highs) as well as macro reversal/transition periods.

So, while I KNOW all of that, it still sucks to watch a string of mostly losing trades and the market trend at the micro level when we’re in one of those periods, when I know the time for our models to catch up is measured in weeks/months.

A truism shared with me some time ago: Active investors MUST have a long-horizon!

1 Like

Well replied; I was fascinated by your comments about the market we have today and that piece of advice that I received came to mind. Glad to hear about your models. Market regime changes don’t often happen at a point in time (such as with a single phrase from a Fed chair), and good long-term systems can indeed take time to verify a change.

It’s been a rough last week anyways, but this morning, we had our first “out-of-sync” trade signal in a LONG time. And it was a very costly one. An out-of-sync trade signal is a signal that either a) is generated in backtesting that does not happen when trading live, or b) is generated while trading live but does not appear in backtesting.

While fill prices may vary a tick or two between live and backtesting, trade SIGNALS should NEVER vary.

This morning, every account we manage (including here at C2) opened a short position around 5:38AM. When I was online later in the morning and saw that open position, looking at the price chart, I was pretty sure that trade should not have happened (market was generally trending up at that point, and our short strat is pretty good about not opening a trade AGAINST the current market direction).

When I did a quick backtest, sure enough, that trade never happens.

The most probable explanation is also an explanation that we cannot verify. Periodically, our realtime market data provider that we receive trade and 1 minute candle trade data from, will “correct” a candle after the fact. For example, in real time, we may receive candle data that says the closing price of the 13:42PM candle was 5221.50. Then, when we receive the price data for the 13:43PM candle a minute later, our data provider could also send a “corrected” 13:42PM historical candle where the closing price has been changed to 5221.25.

What that means is in live trading, our strategy acts on a closing price of 5221.50 for that candle, but in subsequent backtesting, our strategy acts on a closing price of 5221.25 for that candle.

We will be doing two things: 1) keeping an eye on EVERY upcoming live trade, and making sure there is a corresponding trade in backtesting, and 2) auditing our last few weeks of live vs. backtested trade signals (more of a pain than it sounds!) and making sure there have not been any other occurrences.

Yikes, I’m glad to not be dealing with such issues, either potential or realized. Curious how to “keep an eye on EVERY upcoming live trade” in real time… does your system not automatically place the order if the candle signals it? Or will you be delaying orders one minute to make sure that a corrected candle does not show up that negates the original signal? Good luck sir. Personally, I’m happy to be back using trading day candles and putting in orders on the next open. Tick level data provided some interesting insights for me for a while, but I’ve moved on to different trading edges these days.

Sometimes it seems like the universe says “Not today, Chris.” As soon as we stop trading to track down a bug yesterday morning (out-of-sync short trades that are happening live but not in tuning/backtesting), our strategies rack up five straight winning trades, including a whopper short win this morning when the market dumped, for a total 9% ROI gain since yesterday afternoon.

The strategies made back two months of losses in less than 24 hours. Not that it matters since we weren’t trading live. Painful.

Just a quick update that I referenced above. We stopped all trading late yesterday morning as we had a second occurance of an “out-of-sync” trade signal, a (very losing) live short trade across all of our accounts that does NOT appear in backtesting or paper trading.

Anyone who knows software knows that finding the cause of issues like this is searching for a needle in a haystack during a tornado. But we can not responsibly trade live if signals are out of sync with backtest entry signals.

After speaking with our market data provider and the support team for the trade execution software we use, they are basically blaming each other for the problem.

Backtested trade entry signals being in sync with our live trade entry signals is critical: ALL strategy vetting and tuning depends on this for almost ANY algorithm trading system. Fill prices may vary between live and backtest, and even exit signals may vary if dependent on the actual fill price, but entry signals should pretty much never vary unless there is a hiccup in the real-time market data feed, or a hiccup in the trade execution software. Barring those, running the identical calculations on the identical data with the identical strategy should yield identical results (entry signals).

Comparing roughly 160 trades going back to mid-March, I find only three out-of-sync between backtesting and live trading, all of them in our primary short-only strategy (see screenshot below). It is also one of only two strategies that uses market orders to enter a position based on calculations revised every minute, rather than resting limit orders.

The only thing to do now is to add more debug/logging code to our software to record, real-time, EVERY value and calculation the strategy acts on when deciding to enter a position. With that, the next time we have an out-of-sync entry signal, we should be able to compare real-time values with backtest values and narrow down where the discrepancy is.

We have just resumed live trading. Tons of additional logging has been added, and the Maximum Short Position has been reduced by 50% until we have a repeat of an out-of-sync short trade and can determine the cause (and the fix).

Yes, our software automatically places an order immediately when a candle signals it. The potential problem is if we get a “corrected” candle a minute later. Nothing in our logic (currently) says “hey, check that previous candle we entered a position on, is it still the same? If not, would we have still entered a position with the new value? If not, close the just opened position.”

That logic is a pretty good idea actually.

We are not delaying orders. For now, when I see a new open short position, I am running a backtest to see if that trade SHOULD be there, which I’ve been doing since March 27. Yesterday we got a second out-of-sync trade, which means it’s a problem and not just a one-off anomaly, hence stopping trading (post above) and adding a ton of logging to try to track down the issue.

The market is EXACTLY flat from one month ago (March 7), and we have had ONE day out of the last 28 trading days (yesterday) where the market has moved more than 1%. Often going short at the bottom and long at the top of a very tight sideways trading channel, it is a very difficult market environment at the moment for any momentum-based day-trading strategies…

And the one day the market DID move, when our strategies would have made 9% ROI in one day over five consecutive winning trades, we had trading turned off for 24 hours to hunt for a bug (2nd out-of-sync trade signal).

I know it’s not personal, but boy, it feels like it sometimes…

1 Like

Ouch, I would have hoped today’s market moves might pop you back up again, but not sure it’s looking that way. Kudos for putting yourself out here and highlighting some of the problems that can arise with algorithmic trading, and good luck.

2 Likes