The opinions expressed in these forums do not represent those of C2, and any discussion of profit/loss
is not indicative of future performance or success.
There is a substantial risk of loss in trading. You should therefore carefully consider
whether such trading is suitable for you in light of your financial condition. You should read,
understand, and consider the Risk Disclosure Statement that is provided by your broker
before you consider trading. Most people who trade lose money.
Wanted to introduce my new fully hedged trading strategy, based on capturing top-five NYSE/Nasdaq stocks with strongest free-cash-flow-yields…
Trades Five Stocks/Week
Zero-Low Margin
Fully Hedged by Russell 2000 ETF (IWM)
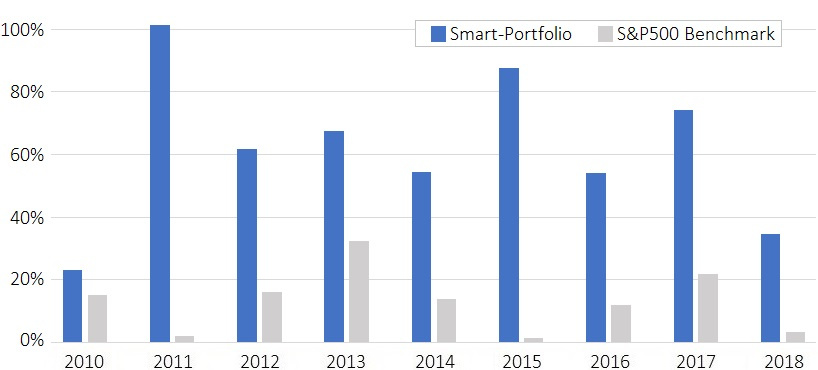
Average Annual Return 62.2%/Year Since January 2010.
Up 34.5% so far in 2018 (January to October).
Zero-Low Margin/Leverage Used.
Based on Fully-Automated, 12-Rule Algorithm.
Profitable in 9/9 Years Since Inception.
Outperformance vs the S&P500 Benchmark in 9/9 Years.
Do you just do a FCF screen every week? You mention a 12-rule algorithm, does it have to do with market cap, profitability, and factors like that, etc? (just to weed out messy situations I assume).
We use multiple screen filters, which double-check the FCF with EBITDA, Operating Income, Cash-Flow. This weeds out any company claiming high income (eg., EPS growth, EBITDA margins) against actual FCF (booked income). The algo doesn’t stop at fundamentals though… we also check institutional (smart-money) buy activity using vol-at-bid, time & sales data, and level-2 activity, completely auto-monitored.
At the end of each week, once all activity is reflected in the data, usually Sunday evening, we run a final screen, which places all ‘qualifying’ stocks into a top-5 ranking. These are then further checked to ensure no company is subject to any major issues (eg., legal / rumor-mill-takeovers), before publishing the top 5, or (in case of C2) putting the trades on.
To @aum108
Part of the strategy is to adjust the FCF/EV yield according to interest rates, as this impacts FCF based ROIC for each company depending on risk-free returns available from savings (ie., interest rates). The algo buys stocks with premium FCF yields ‘relative to interest rates’. This means, I will need to code the algo for pre-2009, and then run the model within this context.
Hope this makes sense… it will take a little time to get the data to you (which can be done from 2000 to 2008, ie., 9 years inclusive). Give me until later today… Thanks for your patience.
As promised, below are results from 2000 - 2009 inclusive…
Below results are based on the top-five ranked stocks, fully hedged by the Russell 2000 ETF (IWM). In other words, the strategy is always long/short dollar-neutral (same $ long/Short)…
Interestingly, the performance improves marginally by hedging with the E-Mini Russell 2000 Futures. Again, the positions are 100% hedged permanently to reduce systematic/market risk…
An interesting thing to see would be how much alpha is generated on the long side. i.e, if it wasn’t hedged, just long only. Although I can kind of gather that for myself based on 100% hedging. You may want to start a long only strategy with that in mind, since it seems to absolutely killing it every year, and since some people can’t short.
Long only shows slightly better results but much more drawdown, which I am totally uncomfortable with. The drawdown on long only are better than the major indexes (eg., SPY, IWM, QQQ), but, still - I just prefer the extra peace of mind against systematic/macro risk.
One thing I am trying out (probably will take up most of today!) is to test the entire 18 years based on hedging using LONG ‘SH’ ETF (inverse S&P, so provides an ideal hedge, without having to short - which helps those accounts which cannot short).
I will post results here later on today.
Hedging is really the best way to manage a portfolio. A portfolio should offer managed risk instead of most of the day trading strategies that are catered to the incredible returns that catches greedy investors.
I hope you success and maybe this will in turn bring in a new generation of strategies that won’t aim for the stars in order to generate subs.
Due to limitations on some older fundamental data, I have not included years 2000-2006, but below is the complete test run, from 1/1/2007 to the present day. The five-stock portfolio is fully hedged by IWM (Russell 2000). A sidenote - it is absolutely (tested okay) possible to hedge by using ‘inverse’ ETF’s, such as SH (S&P500 inverse) or RWM (Russell 2000 inverse), and the results are around 98.9% correlated, basically allowing people who can’t short to trade the strat. Anyway, below are key-stat results, inc drawdowns (note: the annualized returns of 84.91% are based on a fully [permanently] hedged portfolio)…
I guess last question(s):
-How long have you been running this live? Any proof?
-Have you made sure there is adequate liquidity in these small cap names? (i.e. how big can the strategy get?)
Very good questions (esp no.2)…
I have been running the strat in my own account for over 4 months - not a huge amount of time I appreciate. But I am here for the long term, so have complete faith in the method. It is based on a combination of FCF based fundamentals and technicals (esp intraday activity monitoring).
On point 2, I am limiting the strat to around 100 members max, so avoid any major liquidity issues. All stocks (as part of the algo) trade a minimum 50,000 shares/day (64 day avg). They are all US based stocks trading on NYSE/Nasdaq.
If there are liquidity issues, I will probably limit the numbers.
Where did you get this charts? Can you get more backtest data in the long side of trades and short the side of trades?
So far my only concerns are 1. Live test period is still too short. 2. Using backtest as formula for future trading had never yield much profit for me. I have had amazing backtest put together. 50%+ gain for last 18 years, and the 2 years I implemented yield total of 11% in 2015 and 2016. Of course that’s a very small sample.
Best of luck, I will definitely keep my eye on this.
There is a link in the strategy description, but that webpage is only a few days old. https://valuscreen.com
For more backtest data you have to ask the strategy-developer.
.
Agreed, I wish as well that C2-developers would trade a few months live, before posting in the forum.
I guess you will follow your own advise, >>> wait and watch 6-9 live months before investing
I just read the main page of your link. this strategy is very intriguing to me because this is what i do for a living. So i’m very curious how he can achieve those returns while fully hedged.
On his main page, he listed an example of $aapl being down 10% and $IWM will also be down 10%. but in reality is if Apple or other stock are down 10%, most indices are most likely to be down 3-4%. Also I’m interested to see how he is using alpha or gain to purchase hedge and yet able to get 60% worth of gains. Most of the time we use options or carry trade to hedge a portfolio. i’m not even talking about fully hedged, just a partial hedge could cost you 5% to 12% annually performance for a peace of mind protection. So in-order to get 60% return you need to be gaining at least 90-100% return from the 5 stocks. then this also mean the beta of the underlying security vs beta of the hedging instrument is not equal. Most institution overweight or underweight a % of hedge based on VIX, We try to gain an edge on buying less protection during the low volatility and more during volatile times. Then the only other options to able to fully hedge a portfolio is use leverage or margin to make it market neutral during pull backs. If the 5 stocks is worth $100k is down 10%, you will need short $250k of $IWM to hedge the beta of the 5 individual stocks or at least $200k of $IWM.
I’m just very interested to see the longevity of this strategy that wont use any margin, 100% fully hedged 24/7, wont use futures or options and still able to achieve 50%+ gains annually.
I will try an post (hopefully over the weekend) full results on a year by year basis, inc drawdowns etc, from 2007 to 2018. Please bear with me…
I am also checking the performance by using long RWM (inverse Russell 2000) for those who are unable to short (effectively, this means, 50% of the portfolio is long the five shares, and 50% is long RWM, which provides the hedge).
One thing I would mention, is that in my own trading, I am using e-mini-Russel2000-futures (symbol: RTY) as this provide marginally improved results. I can put together a PDF for those who are interested in hedging with R2K futures. One contract is currently worth around $77500, so this would mean you would need to also be long the 5 stocks with the same value (ie., 5 x $$15.5k), to create a dollar-neutral hedge.
The take-away is, hedging can be used effectively using any liquid instrument available (in my case, RTY futures, but okay with short IWM, or long RWM).