I intend this post to share a more reasonable view on the investment process.
I’m a trader of Wait4Trade team, and I’m going to write for the whole team.
We’ve got rich experience in trading strategies development, and we would like to share it.
We want to tell about the way strategies generate profit, what indicators you should pay attention to, how to evaluate the future perspective, etc.
The need in this post arose after reading the strategies discussion on the C2 forum, as well as facing the situation with subscriptions to various trade leaders.
The objects of attention of investors are not the strategies that deserve it.
Often, investors face strategies that are not worth any attention.
How to evaluate the strategy.
To evaluate the strategy, you’ll need the following data:
- Strategy description from the trade leader and communication capability (a good trader is not a “hikikomori” or a mad isolated scientist).
- The maximum and minimum lot for each instrument.
- Strategy Age and Number of trades.
- Winning trade percentage.
- Trades duration (opening and closing time).
- Maximum drawdown.
- Rate of return.
1. Strategy description from the trade leader and communication capability.
It is important to have instruments to compare the actual trading process with expected. You should make sure that there is a system and a trader adheres to it.
Don’t you ever think that for investor there are strategies too difficult to understand, and details which are better not to get into.
Quite the contrary: strategies are primitive in their simplicity, and investor must have the understanding of what a trader is doing and whether he isn’t gone mad.
2. The maximum and minimum lot for each instrument.
Everyone raises the lot. All Ladies Do It. Those who do not - deserve the closest attention. They are either geniuses and have pure Insight on the market, or they fell into fatal luck.
We need this max and min lot value in order to determine the step size and the number of steps to increase the lot.
Having 3-5 steps in the order: 1, 2, 3, 4, 5 lots; or 5-10-15-20-25 lots; i. e. +1 starting lot, is a normal, reasonable approach to profit taking from a strategy that gives 0 ticks (this is a good strategy).
But when you see that starting lot is 1, and the highest is 50-300, then this is just an uncontrolled martingale which will lead to one losing trade for the entire deposit.
Of course, everyone heard about the martingale, but in fact nobody uses the classic martingale. Instead, averaging into a position martingale is in use.
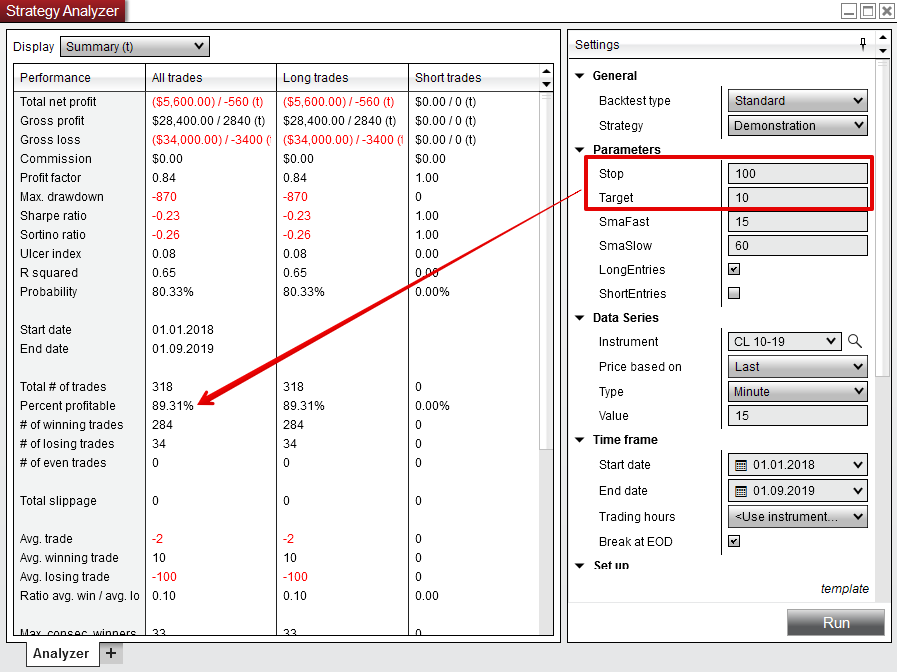
To get over 90% of profitable trades, you just need to stop placing a stop-loss order and set a short target. But there will definitely be a situation when the price goes against the position, and in order to quickly bring it into profit, averaging is used with a simultaneous increase in the lot. For example:
Lot 1 of crude oil was bought at the price of 60, the target at 61, i.e. $1000 or 100 ticks per lot.
Price dropped to 55:
The first position in lot of 1 has -500 ticks, or -$5000. In order to hold a target of 100 ticks and make a profit of $1000 (to get a profit of $1000 at a price of 56), another 5 lots of crude oil are bought, and that is 6 in total.
Price dropped to 50:
The first position in lot of 1 has -1000 ticks, or -$10000
The second position in lot of 5 has -500 ticks, or -$25000
Total: -$35000
In order to hold a target of 100 ticks and make a profit of $1000 (to get a profit of $1000 at a price of 51) up to 36 lots are needed, which means buy 30 more.
And so forth.
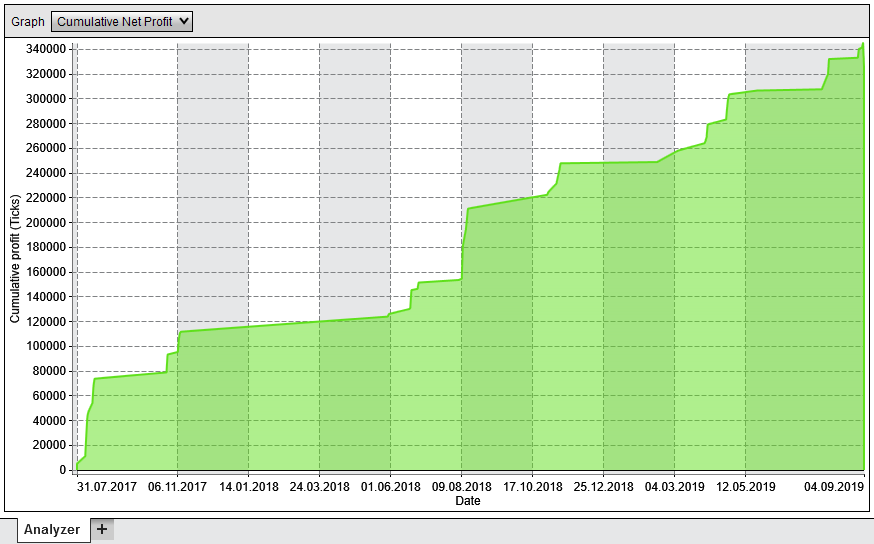
As a result, the profit chart will look like this:

3. Strategy Age and Number of trades.
The minimum number of trades is no less than 100 for a period of at least 2 months.
Basic statistics require a minimum 100 trades. In our outcome evaluation of algorithmic strategies, we started with 1000 trades, and the more experiments are made the more accurate data and more unbiased evaluation obtained.
Without a description of the strategy essence, 100 trades are still not enough, since there is no way to compare the data obtained with the main concept. (see Section 1)
4. Winning trade percentage.
This is one of the most important indicators; It reflects the trading methodology.
When selecting strategies, we recommend looking for <= 60% instead of >=.
The fact of profitable trades indicator is less than 60% shows that the trade leader uses stop-losses, and he probably has an understanding of where his forecast stops working (but that is not necessarily right).
Most long-term strategies (10 years and more than 1000 trades) bring a profit of 0 before commissions, the best bring a profit of 0 after commission, regardless of the percentage of profitable trades.
The percentage of profitable trades primarily indicates risk management.
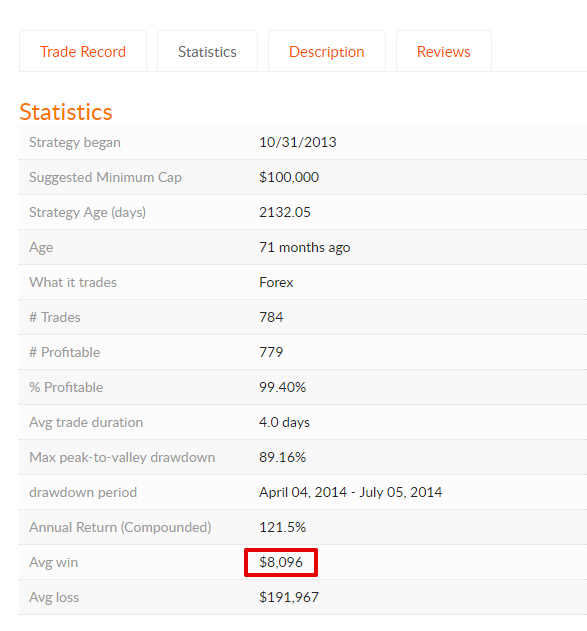
To get a high percentage of profitable trades (>80%) is just needed to place the stop-loss to target ratio as 10 to 1.
Of course, it is better to remove the stop-loss at all

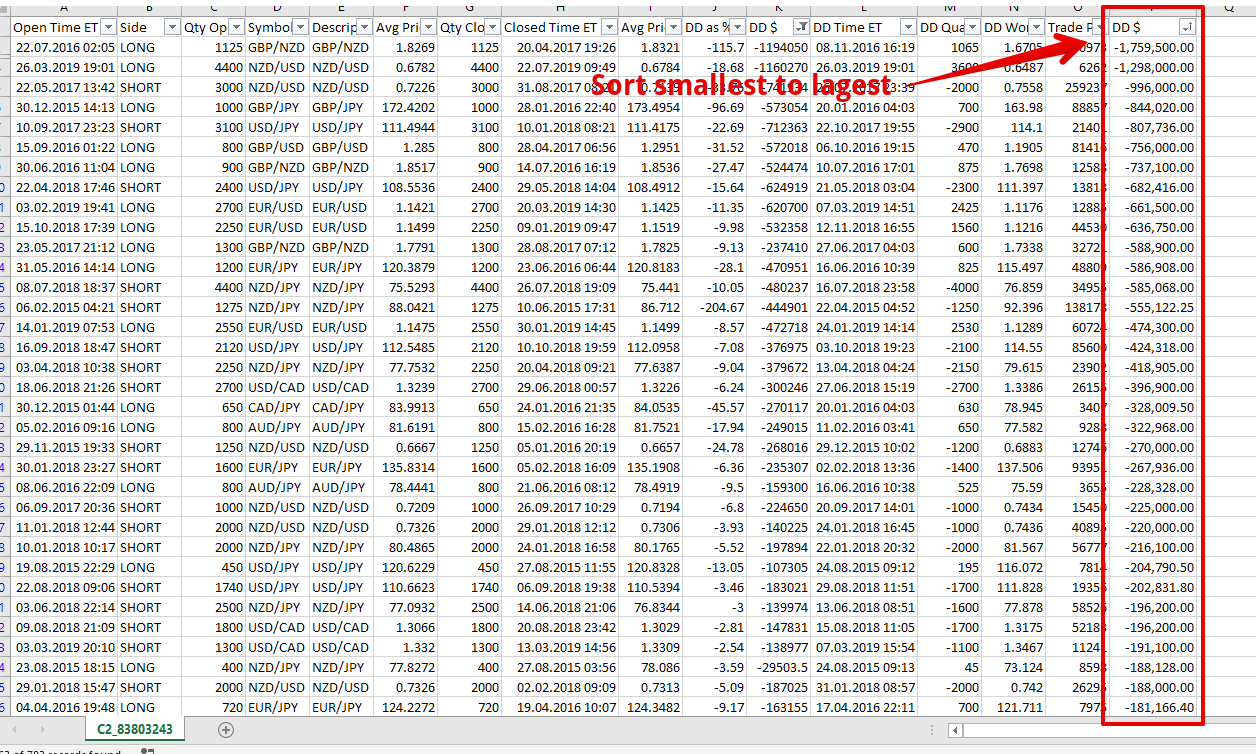
5. Trades duration (opening and closing time).
This parameter helps to understand the stop-loss limit, if any.
It will require manual work with Excel: finding the longest trades and determine how much the market has gone against this position using data on entry and DD Worst prices.
Compare that with profitable trades and get an idea on the stop-loss and target ratio.
Stops? No - I have not heard.
6. Maximum drawdown.
This is just a historical fact, and in isolation from understanding the risk and lot management means absolutely nothing.
For example, strategies with martingale averaging can show exceptionally good results, but with drawdowns, your loss will grow exponentially.
It is worthwhile to avoid strategies with a high indicator of maximum drawdown, but don’t expect that your maximum risk is limited only to this indicator.
Even for automatic strategies, real drawdowns are always higher than historical ones. “PAST RESULTS ARE NOT NECESSARILY INDICATIVE OF FUTURE RESULTS.” - you remember, yeah?
7. Rate of return.
Rate of return of the strategy can be estimated in two ways:
- Money Profit
- Tick Profit
It may seem all the same. If there is a profit in money, then there is a profit in ticks too. But this is not so.
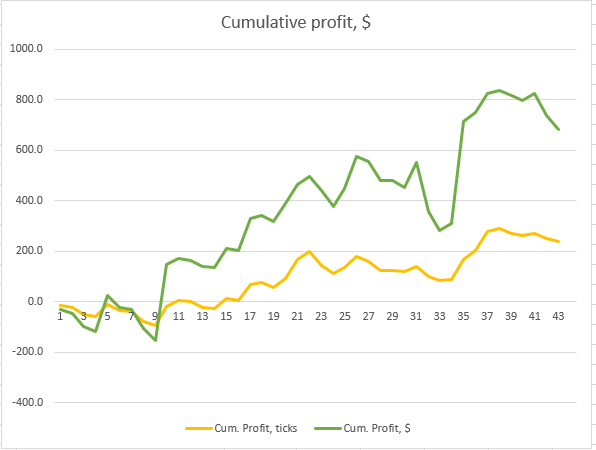
It’s a great thing when the strategy shows a positive number of ticks, but our backtest experience on the history of 10 years shows that all strategies tend to 0, the only difference is how this happens: evenly or as a result of a large unprofitable cycle.
When the tick profit looks like a short sinusoid around 0, then you’ve got a good strategy, that, with a reasonable increase in the lot (+1 starting lot, up to 5 steps of increase), will give a stable 1-3% profit per month.
But when the sinusoid is extended, long cycles take place, and that in turn means that months of profit turn into months of losses and such a strategy can’t be considered as stable.
Money/percent return, as well as the maximum drawdown, in isolation from understanding the principle of the trading approach means nothing.
Only after selecting strategies using lot management model and risk management, you should pay attention to rate of return as the final choice factor.
Examples of bad, good, and excellent strategies via sinusoid of tick profit.
Bad - expanded sinusoid.

Good - short sinusoid around 0.

Excellent - rising short sinusoid.

We want to contribute to the development of Collective2 service in particular and trading in general, and encourage good strategies creation and their fair evaluation by the investor community.
If you’re interested, in this topic we all together can gather and analyze any Collective2 strategies.