It’s been a year since I wrote into this topic.
I watched with interest how my first analysis worked.
I can conclude that rejected strategies showed generally expected results.
But of the three I approved, on the horizon in six months: two got a positive return, one got loss.
Here they are, the investment horizon from November 2019 to March 2020:
I think to continue; the year was interesting, many strategies showed excellent equity. But what about their prospects?
During this time, I added forms to my analysis, systematized it into 3 points:
- Quantitative
- Qualitative
- Behavioral
Quantitative analysis
The purpose of this analysis:
- filter out deliberately bad strategies
- filter out strategies with insufficient data
- split strategies into clusters
Collective2 provides just such an analysis, and it does it well, probably better than anyone else in this public data market.
Qualitative analysis
The purpose of this analysis:
- understand the trading style
- evaluate the superiority of the strategy by comparing the win rate with random trades
- evaluate the quality of lot management
Behavioral Analysis
The purpose of this analysis:
- determine the uniformity of the trading style
- appreciate the stability of the style in drawdowns: is there any panic there
- examine extreme events: data that strongly out of the general picture
Quantitative analysis
I filtered the strategy C2 grid, the main ones are:
- strategy age >= 180 days
- trades number >= 250
- maximum drawdown <= 50%
- % winners <= 90%
- return for the last 180 days >= 15%
- maximum leverage <= 50

I am not affiliated with the leaders of the strategies mentioned below; I ignore and will ignore in the future all attempts by the leaders to contact about placing their strategies.
The only leaders I communicate with are those whom I personally urged starting working on C2, but at the moment they all do not pass the time filter.
If I include their strategies in the list, I will report this separately.
EMNQ Trader


Qualitative analysis
Trading style:
Short-term trading with transitions in the medium term.
It uses risk controls.
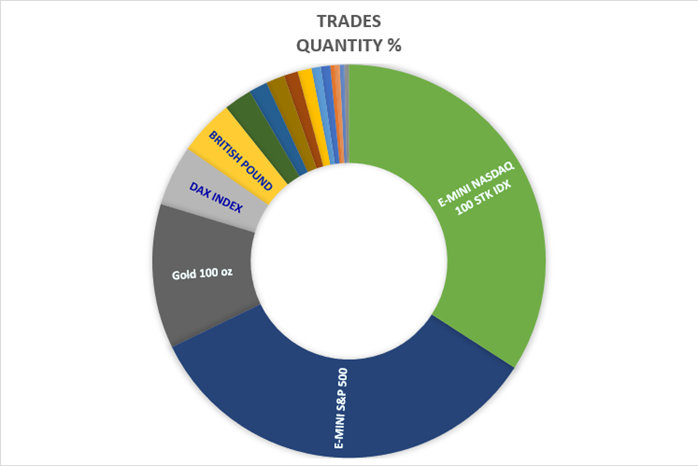
Diversified trading through 3+ trading instruments.
Win/Loss Ratio 0.96, this excludes averaging to lose positions.
Superiority:
At Win/Loss Ratio 0.96, random entries show 50.8%. In this strategy 55.9%, hence the superiority in a sample of 371 trades is 5.1%.
Lot management:
Uses.
In the flat CP,% phase, an increased volume is observed
Behavioral Analysis
Uniform trading style:
Homogeneous. It can be divided into two phases: a volume increase during the flat CP phase,% and a volume decrease to a minimum during the CP growth phase,%.
Stability of the style in drawdowns:
On the data, we already see two CP phases,% flat and the behavior is the same, this indicates stability.
Extreme events:
Not observed.
Conclusion
Sustainable strategy with good superiority, risk management and adequate behavior. I recommend.
MYM MGC


Qualitative analysis
Trading style:
Short-term trading with transitions in the medium term.
It uses risk controls.
Diversified trading through 3+ trading instruments.
Win/Loss Ratio 0.91, this excludes averaging to lose positions.
Superiority:
At Win/Loss Ratio 0.91, random entries show 52.5%. In this strategy 60.2%, hence the superiority in a sample of 335 trades is 7.7%.
Lot management:
Used evenly. There is a gradual increase in volume position, possibly due to an equity increase.
Behavioral Analysis
Uniform trading style:
Homogeneous.
Stability of the style in drawdowns:
There have been no significant drawdowns yet. The strategy performed well with CP drawdown,% in the first 60 trades.
Extreme events:
Not observed.
Conclusion
Sustainable strategy with good superiority, risk management and adequate behavior. I recommend.
EFutrs Index

Qualitative analysis
Trading style:
Short-term trading with transitions in the medium term.
It uses risk controls.
Diversified trading through 3+ trading instruments.
Win/Loss Ratio 1.06, this excludes averaging to lose positions.
Skewness long trades - 66%
Superiority:
At Win/Loss Ratio 1.06, random entries show 49.01%. In this strategy 59.1%, hence the superiority in a sample of 402 trades is 10.09%.
Lot management:
There is a reduced volume in a CP drawdown,%.
Behavioral Analysis
Uniform trading style:
Up to 255 trades the strategy was short-medium term. Now it’s 100% intraday.
Stability of the style in drawdowns:
The strategy performed well with CP drawdown,% in 1-70 and 307-385 trades. In this period position volume was reduced
Extreme events:
Not observed.
Conclusion
Sustainable strategy with good superiority, risk management and adequate behavior. But it has 66% long trades. Skewness is potentially risky for short-term strategies. Nevertheless, the rest of the indicators are normal and I am ready to recommend this strategy for diversification.
ES Russell


Qualitative analysis
Trading style:
Short-term trading.
It uses risk controls.
Diversified trading through 3+ trading instruments.
Win/Loss Ratio 1.07, this excludes averaging to lose positions.
Skewness long trades - 67%
Superiority:
At Win/Loss Ratio 1.06, random entries show 48.1%. In this strategy 57.5%, hence the superiority in a sample of 464 trades is 9.4%.
Lot management:
Didn’t use before drawdown. Now there is a significant position volume increase.
Behavioral Analysis
Uniform trading style:
Not uniform.
Stability of the style in drawdowns:
First 300 trades, the strategy didn’t use lot management, and this was changed after drawdown in the period after 365 trade.
Extreme events:
34 and 35 trades duration. I propose to consider this deviation not significant.
After 420 trade position volume significantly increased.
Conclusion
Although the strategy successfully passed the PV,% drawdown period, it showed that it can significantly increase the risks in drawdown moments.
Risk itself is not a critical moment if it is rewarded appropriately. In this strategy, the potential risk is higher than the return.
Also, it has skewness to long trades, and it’s additional risk for short-term strategy.
I don’t recommend.
The ML Bundle


Qualitative analysis
Trading style:
Short-term trading.
Not sure about risk control, looks like a reverse trading.
Diversified trading through 2+ trading instruments.
Win/Loss Ratio 1.31, this excludes averaging to lose positions.
Skewness long trades - 56%
Superiority:
At Win/Loss Ratio 1.31, random entries show 43.08%. In this strategy 52.7%, hence the superiority in a sample of 261 trades is 9.62%.
Lot management:
Practically not used.
Behavioral Analysis
Uniform trading style:
Uniform.
Stability of the style in drawdowns:
Stable. Did not change in drawdowns.
Extreme events:
5 trades with significantly differs results in P/L,%. It looks like a result of reverse trades.
Conclusion
Strategy looks like automated with minimum PV management and low risk per trade. It’s PL,% equity looks like the lucky result of small sample. In this strategy you don’t lose much in short term but in every moment it can be the last high in its life. I suggest coming back to it after 500 trades.
X GoldFutures

Qualitative analysis
Trading style:
Short-term trading with transitions in the medium term.
It uses risk controls.
Diversified trading through 3+ trading instruments.
Win/Loss Ratio 0.99, this excludes averaging to lose positions.
Skewness long trades - 65%
Superiority:
At Win/Loss Ratio 0.99, random entries show 50.88%. In this strategy 57.8%, hence the superiority in a sample of 484 trades is 6.92%.
Lot management:
Using in drawdowns.
Behavioral Analysis
Uniform trading style:
Not Uniform.
Stability of the style in drawdowns:
Stable. Position volume increase in drawdowns.
Extreme events:
Extreme cluster in first 100 trades of trade duration. Can be ignored as the rest is stable.
Conclusion
Good position volume allows to generate positive equity in flat PL, %. I don’t like skewness to long trades in short-term strategies, but now is trend tendency. I think we can take risk for this strategy.
Clear Futures


Qualitative analysis
Trading style:
Short-term and medium-term trading.
It uses risk controls.
Trading one instrument, Mini Dow.
Win/Loss Ratio 3.69, this excludes averaging to lose positions.
Skewness long trades - 0%
Superiority:
At Win/Loss Ratio 3.69, random entries show 21.87%. In this strategy 26.8%, hence the superiority in a sample of 356 trades is 4.93%.
Lot management:
Not using.
Behavioral Analysis
Uniform trading style:
Uniform.
Stability of the style in drawdowns:
Stable. No Position volume.
Extreme events:
Some trades with larger losses than usual don’t have influence on the strategy stability.
Conclusion
This strategy is strictly focused on positive PL,%. On the one side it’s the strong point for low risk in one trade, on the other weakness in drawdowns. This strategy hasn’t instruments to be profit in flat PL,% ticks.
I think we can take risk for this strategy. It gives good return for the risk. So, I suggest investing with stop following on 20% drawdown.
NASDAQ Mc


Qualitative analysis
Trading style:
Short-term and medium-term trading.
It uses risk controls.
Trading one main instrument and some additional.
Win/Loss Ratio 1.00, this excludes averaging to lose positions.
Skewness long trades - 65%
Superiority:
At Win/Loss Ratio 1.00, random entries show 50.00%. In this strategy 55.4%, hence the superiority in a sample of 711 trades is 5.4%.
Lot management:
Uses.
Behavioral Analysis
Uniform trading style:
Not uniform. First half is medium-term, the second is short-term. There is a cluster with extreme PV raising.
Stability of the style in drawdowns:
Stable. Good PV management allows not to lose in PV,% drawdowns.
Extreme events:
16 and 14 days trade duration in November 2019 and January 2020.
A cluster with extreme PV raising in September 2020.
Conclusion
This strategy has an excellent position volume management. The only thing I don’t like is high PV in Sept 2020, yes it got a huge return, but this means that there was also a significant risk. Stop 30% and go!
Tendency Forex


Qualitative analysis
Trading style:
Medium-term trading.
It uses risk controls.
Great diversification.
Win/Loss Ratio 0.86, this excludes averaging to lose positions.
Skewness long trades - 54%
Superiority:
At Win/Loss Ratio 0.86, random entries show 53.85%. In this strategy 61.00%, hence the superiority in a sample of 1790 trades is 7.15%.
Lot management:
Uses.
Behavioral Analysis
Uniform trading style:
Two clusters by PV.
Stability of the style in drawdowns:
Stable. Good PV management allows not to lose in PV,% drawdowns.
Extreme events:
Two trades with over 15 days’ trade duration.
Conclusion
The best strategy of this list. High diversification by instruments, good position volume management, 1790 trades(!) and 606 days. Highly recommend.
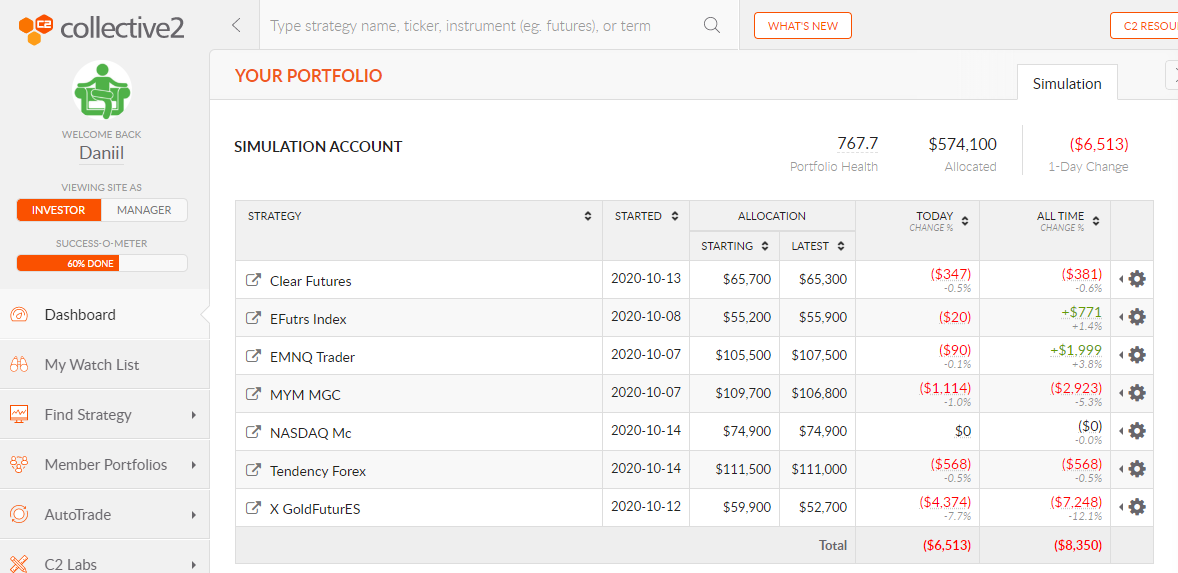
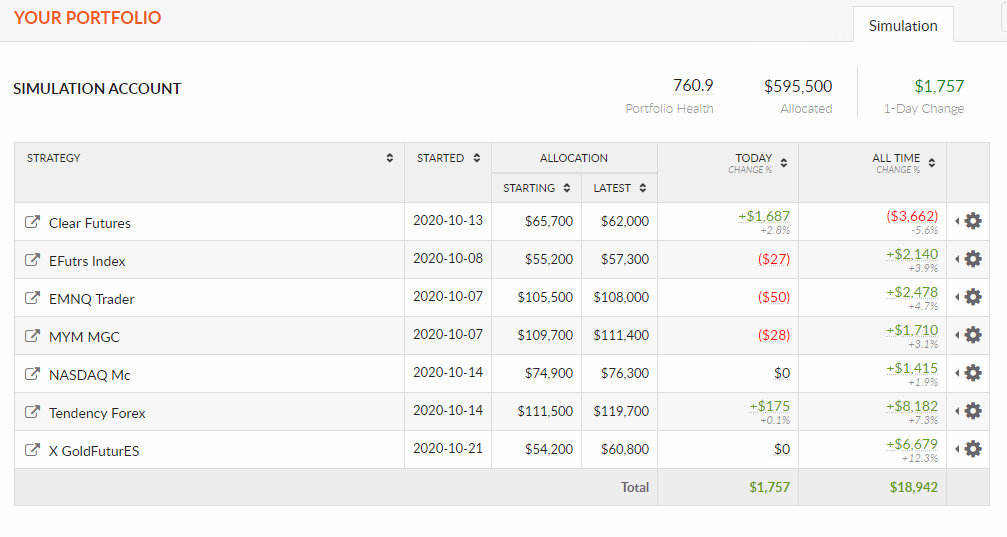
While doing this analysis for you I figured out how I can do it better, but next time. I added all the selected strategies to the simulation. I’ll show the result in two months.
if you liked my work, you can support me on Patreon: https://www.patreon.com/waitfortrade