'SP 500 Futures Scalper' and 'SP500/NASDAQ Scalper' 50% off

What a nuisance when your strategy thread gets trolled by someone with a one day old account…

Again, IF you bothered to read the history of these strats, I do completely and proactively acknowledge both points. My “red” end of January and February here on C2 was me trying to figure out how to get what I’ve been trading since May 2022 in my real job (which has been green EVERY month, trading a LOT more than is traded here) to work as best as possible within the constraints and nuances of C2’s BrokerTransmit system. And YES, as previously covered and I am forthcoming about EVERYWHERE, including the descriptions of each strategy on their strategy pages, each of these two strategies experience periodic double digit drawdowns. A subscriber has to be OK with that, or these strategies are not a good fit for them. Which I say literally EVERYWHERE.

If you’d like to (re)state anything else completely obvious/redundant and/or already covered elsewhere, feel free to message me privately or start a new thread called “I just joined C2 and I like randomly throwing rocks and restating the obvious”.

You’re making a great first impression.

Well we are now officially in double-digit drawdown territory AGAIN.

Initial jobless claims at 8.30 a.m. this morning, economists expected a small rise but it surprised and fell to lowest level since February, underscoring a resilient economy. Any good economic news = market jumps off a cliff out of fear of the Fed raising rates again…

Historically, including in backtesting, August and September tend to be our most challenging months. I’m not 100% sure why; it could just be that these two months are historically poor performers for the market as a whole, and our strategies are inherently long-biased (which we know by looking at the majority of the market trend over the period of time our models train on).

Unless we see a crazy rebound in the next day or two (highly unlikely), it looks like we’re going to be holding a steaming bag of dog crap going into expiration week next week, which is a first for me.

I have to figure out exactly how I’m going to handle that logistically, but if it doesn’t stop out on its own, sometime in the next couple of trading days I’m going to have to manually close out our current position (for a BIG loss at the moment), and consider whether or not to immediately re-enter a long position for the December contracts and allow the strategy to continue (sort of) with the current trade.

@Chris: It seems pretty obvious that your overnight and early morning trades are killing your performance. Why don’t you offer a strategy which is a real scalper and only holds for 1-2 hours and gets out on drawdowns?

So, I’m fairly surprised by how often I get asked (either in the forum or via DM) some flavor of the question “why don’t you just publish a strategy (or change your current strategy) so that it consistently makes money, but without the big drawdowns (or with tight stop losses, same thing)?”

So, when you read that question objectively, you probably realize how silly that question is. In case you don’t, here is my response: “If I had a strategy that worked with C2’s framework and consistently makes money WITHOUT the periodic large drawdown, DON’T YOU THINK I’D BE PUBLISHING THAT INSTEAD?!”

Now, in my non-C2 life, we DO run a strategy that is something along those lines: a scalping strategy with a TIGHT take profit target (like 6-8 ticks) and a TIGHT stop loss (around 26 ticks I believe). It places a limit entry order that, when filled, immediately triggers an OCO order with the take profit Limit order exit as well as the Stop Loss exit Stop order. And this strategy actually does pretty well, usually holding an open position for no more than a few minutes (and often less than a minute). However, with that TIGHT take profit target, while it may work for us, there is NO WAY it will work within C2’s framework (which they are very clear about, and correctly so). Regardless of what order types I place in our IB accounts, C2 only broadcasts executed trades, and then only as market orders to subscribers. A subscriber would get murdered executing those trades as market orders, AND a few seconds later.

So, how does our current strategy here on C2 perform if we place tighter stop losses on the trades? Here’s the answer, backtested for 2023 with various Stop Loss levels:

The bottom line is, for these strategies, DOUBLE DIGIT DRAWDOWNS are part of it. I understand if that’s not your thing, NO ONE likes going through it, including myself. If you don’t have the stomach for that, that’s OK, and the answer is simple: DON’T SUBSCRIBE. But there is a reason I trade these strategies live in my personal accounts, as well more complex versions for clients trading WAY more than is reflected here: THE FUNDS WE HAVE ALLOCATED TO THESE STRATEGIES ARE OUR HIGH RISK/REWARD ALLOCATION, AND TO DATE QUARTER OVER QUARTER, THEY HANDILY BEAT THE MARKET.

Believe me, when we come up with a 100% automated strategy that has great returns AND has minimal drawdowns, AND that works within C2’s framework, I’ll be publishing it and advertising it to the moon. There may be other strategies here on C2 that already meet those criteria, and if so, let me know so I can subscribe!

But until then, I’m offering what I’m offering: a 100% automated strategy with a (so far) outsized return for the periodic double digit drawdown. PLEASE stop asking for tighter stop losses, a “better” strategy, etc. Our clients have prioritized ROI/MaxDD and are OK with the occasional double digit drawdown. If you’re going to subscribe, you need to be too.

Hi Geoff, my post above may answer this, but also, as these strategies are inherently long-biased (I address this elsewhere, but it’s basically a result of the macro market trend for the majority of the timeframes our models train on), you do see more “not ideal” trade entries in weeks/months that the market is getting killed (Feb, first 2-3 weeks of Aug, Sept so far), including (and maybe especially) overnight trades when lower volume moves the price.

What we’ve seen (at least so far) is that we have not had any luck coming up with solutions to reduce long trade entries or drawdowns during periods of market pullback that do not overly adversely affect our ROI (and ROI/MaxDD) over time. In other words, we can “overtune” to reduce our drawdowns during bad market weeks/months (remembering of course that we typically only know they’re bad once we’re well into them, and then, we don’t know when we’re going to come out of it until we’re well out of it), but at too great a cost over time.

Lastly, even though we do see more frequent significant drawdowns during bad months for the market, these strategies DO historically do well even then, even if it’s a less straight path to get there. Pretty much all of 2022 is a great example. While we were not on C2 yet, outside of C2 we were trading these same strats since May 2022, and they returned green EVERY month. The market as a whole definitely did not.

I guess maybe you don’t work with automated trading/tuning, or at least didn’t read the parenthesis where I answer this exact question?

Our models are AI-generated and trained and tuned on one minute data going back to early 2020. Using any metric, the market has gone up more than down in that timeframe. Hence, the inherent bias.

You’ll note I said “long-biased” not long-only. Of the two strats, one IS long only, the other goes long or short.

Absolutely. Let me know how you automate detecting “CURRENTLY developing” is a way that backtests great over an extended period of time (“currently developing” is always obvious when you have the future data of it fully developed, but not so much during the developing in real-time) and I’ll be thrilled to look at implementing it. We DO have certain safeguards in place, including not entering a trade when the market is trending against that position on the micro level, but even when the market is going against a trade direction on the macro level, I hope you would agree there is plenty of volatility during the day to take small profits on longs AND shorts.

As I said, we go long AND short.

Oddly enough, I don’t seem to get these questions much over the last six months as these strategies were printing money with very little drawdown. Only during a bad time for the WHOLE market, when we then have the very drawdowns I say EVERYWHERE are a known and expected characteristic of these strats, does everyone become the “why do/don’t you” expert…

Ah, THIS explains it… again with the one-day old critics…

1 Like

DUDE SERIOUSLY??!! You mean everyone on C2 (and everywhere else on the planet) has been spending bazillions of hours and dollars trying to identify trends early and successfully trade the market, and you’ve been sitting on the “simple parameters” all this time??!! You must be crazy rich and successful.

Backtesting your “very simple” solution is easy enough, let’s check it out. I’m super excited to be rich here momentarily.

Here’s a simple PowerLanguage/EasyLanguage script that enters a long when crossing above the SMA 20/50/200, exits when crossing below the SMA 20/50/200, and does the opposite for short positions:

I can smell the money now. Let’s backtest this, going back through 2022 on one minute candles trading one S&P E-Mini futures contract, and see how many Lambos I’m buying…

Wait, WHAT?! What happened here? Wasn’t this “very simple” solution of yours applicable to improving hundreds of trend-following systems?

OK, sarcasm aside, your “very simple” solution does not identify a “currently developing” trend… by the time the price crosses the SMA 20 AND 50 AND 200, that is not “currently developing”, that is developed, printed, sold, and in the history books.

I’m assuming you’ve never actually traded before (at least not using a consistent or technical process). This is just to say, it’s a bit more complicated than an SMA crossover.

Easy enough to test the value of that, just adding the following filter logic to my strats running here:

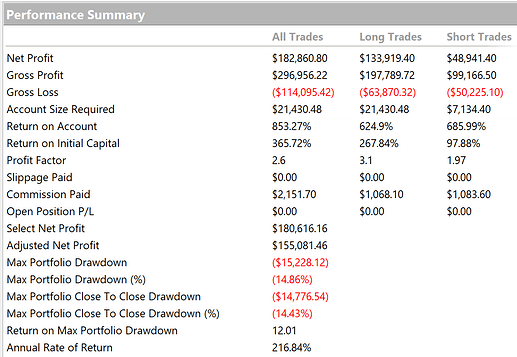
These strats backtested in their current iteration to the beginning of 2022 but with the above TripleSMA Filter:

And in their current state without the TripleSMA Filter:

So, using the TripleMA Crossover as a filter for entering positions reduces my net profit by about $80K while reducing my MaxDD by about $2500. Why? Because by the time I wait for that level of trend confirmation, pretty much any edge a strategy may have to detect a trend early is gone.

To be clear, I’m not saying that the Triple MA Crossover doesn’t serve as a (rather late) confirmation of a trend direction, but by the time you get to that point, that is a FAR CRY from detecting a currently developing trend, as that ship has long since sailed by the time you reach that level of confirmation. By the time you get that level of confirmation, any edge a trading system has in trying to detect a trend direction as early as possible is pretty much gone if your TripleSMA Crossover is a filter.

Believe me, I would LOVE for you to be right, which is why I tested it, just in case. But you’re not. At least not for automated systems and/or algorithms looking for an edge.

If you would like to continue this discussion, or a discussion on any other topic you’ve read recently on Investopedia, please feel free to start a new thread, as THIS thread is supposed to be about the two strategies I publish here. Thank you.

UPDATE:

I’m posting two new coupons, both good for 50% off your first two billing cycles for new subscribers, which expire October 10:

SP 500 Futures Scalper: UGXB44367

SP500/NASDAQ Scalper: UGJJ36344

If you subscribe this week, I would suggest NOT turning on automated trading in your account until after this week. As you may know, this is one of the four weeks a year with the simultaneous expiration of stock options, stock index futures, and stock index options contracts, all expiring this Friday (“Triple Witching” day). Triple witching days, particularly the final hours of trading preceding the closing bell, can result in escalated trading activity and volatility as traders close, roll out, or offset their expiring positions.

On top of which you have the next Fed CPI report coming out on Wednesday. All of which likely means heightened and erratic volatility (more so than normal).

Sometimes escalated and erratic trading activity and volatility works in our favor, other times, not so much.

Just a suggestion, thanks for following along!

Well, the initial market reaction to the August CPI data didn’t do our long positions any favors.

It has since bounced back to where it was before the CPI data, but the day is young.

Our ESZ3 long position we entered on Monday stopped out on that candle. We are still holding the MESU3 long position we entered on 9/5.

I believe we are at about a 7% drawdown since the beginning of the month for the SP 500 Futures Scalper strategy, and about a 3.4% drawdown for the SP500/NASDAQ Scalper strategy.

As you can see from the screenshot below I just took on Bloomberg TV, September is not a stellar month for any automated long-biased strategies.

That being said, we were green for August (albeit red until about the last week), and in my non-C2 life, green for every other red market month going back to May 2022. So we are trusting the strategy.

The rest of this week will continue to keep our long position on edge (assuming it doesn’t stop out), with the US retail sales, PPI, business inventories, and initial jobless claims data coming out tomorrow morning, and then Friday being one of four days a year with the simultaneous expiration of stock options, stock index futures, and stock index options contracts (“Triple Witching” day).

We still have over two weeks to go, but September may very well be our first red month (read above why I don’t count Jan and Feb on C2, as those losses were me figuring out getting our strats converted to work within C2 BrokerTransmit requirements/constraints). If so, that’s terrible timing for me deciding to promote these strategies for the first time, but if history is any guide, we’ll hopefully make it back pretty quickly.

Also, either this afternoon or tomorrow morning at the latest, assuming our Sept future contract positions are still open, I’ll be rolling over any open Sept positions to December contract positions.

Just an FYI for your own knowledge, if you use Interactive Brokers (maybe other brokers have this as well), there is a “Calendar Spread” order type that simultaneously sells one expiration date contract and buys another expiration date contract. Pretty easy.

On my end, I execute that trade, update Multicharts (which we use for order execution) symbol mapping to point our strategies to the December contract, and restart Portfolio Trader, offsetting the “entry price” for the open position by $50 as the December contract runs 50 points more expensive than the Sept contract.

The market on pretty much every third Friday…

dont-jump-jump

Just an FYI, a Multicharts bug/glitch during Interactive Brokers maintenance window around 12:22am caused Multicharts to think that a resting order it had placed had been cancelled by IB (which it hadn’t), so we had an orphaned resting Stop/Limit order that was filled at 2:36am, incorrectly closing our 10 MES long position for our “SP 500 Futures Scalper” strategy. I tracked down the issue and manually placed a 10 MES long order at 4:17am to get it back in sync wit the strategy.

I had this same issue a couple of weeks ago with a non-C2 account, and after about a 20 email exchange with Multicharts support, they said it’s not their problem/fault.

As this has the potential to affect many of our accounts, we are working on a solution outside of Multicharts that could automatically correct out-of-sync positions between what they are on IB and what Multicharts thinks they are.

Because it’s a day that ends in ‘Y’ in September…

Meanwhile our strategies are held hostage in a long since 9/5 because the market has stayed in a <2% range below our profit target since then… :roll_eyes:

Tomorrow’s new policy statement and interest rate decision from the Fed at 2 p.m. EDT, and subsequent Jerome Powell press conference at 2:30 p.m., will likely be a make or break for our month. Pretty much everyone expects the rate to stay as-is this month, but what will have the market acting like nervous school children (as usual) will be trying to read the tea leaves of their updated dot plot and likelihood of a raise at the next meeting…

I just come here for the gif’s, can’t wait to see Wednesday’s edition lol. Good work you’re doing if I had deep pockets I’d subscribe to you instead all I can do is enjoy your thread immensely!

1 Like

The market every time Jerome Powell opens his mouth:

kermit-panic

Well the Fed spoke, and as usual (16 out of the last 17 times after their two day meeting), the market jumped off a cliff:

More times than not over the past two years, the market has completely recovered to pre-Fed meeting/statement prices by the end of the following week. Let’s hope that happens before we stop out…


:scream:

1 Like

Yes, far and away our worst month yet. Not that it’s any consolation to any subscribers, but I’m personally down almost $300K since 9/5 trading these as well, so I’m right there with you and then some. And that doesn’t include our clients’ drawdowns.

Last month, we (and the S&P) were down significantly through the first three weeks, only to recover to green for both strategies by the end of the month. However, while the S&P dropped more last month, we weren’t down THIS much in August.

Worth noting is that after 14 out of the last 17 Fed meetings/statements going back to 9/22/21, the S&P had fully recovered AND was at or higher than the pre-Fed meeting/statement market price no later than the end of the following week.

Let’s hope this is #15, and we claw back some of our catastrophic losses for this month through next week.

Well, if it does recover next week, it’s not before we stopped out first.

If Jerome Powell wasn’t already off my Christmas card list, he would be now.

S&P is exactly at August low, down over 125 points since Jerome Powell opened his mouth yesterday afternoon, sure would be nice to find some support sometime soon…

Update: the market is still getting it’s a@$ kicked post-market. This was apparently the other headline this morning that kept the market flying off the cliff “U.S. jobless claims fall to 8-month low of 201,000 with businesses avoiding layoffs” bolstering the Fed argument for “higher for longer” and providing ammo for an increase at their next meeting… that plus yesterday equalled the “sell everything” snowball we got today…

image