I tried to summarize a few things I have said before in several different places such as my thoughts on which leaderboard is best, which strategies will survive long term, whether is actually possible to beat the market, and some basics to avoid disaster when following strategies.
4 Likes
Thank you for your wonderful article. However could you please respond to this:
- No one is a fortune teller. Assuming no one is cheating, no one can predict fair coinflips over and over again at a rate better than 50%. They can’t! They may get it right the first time and start with a 100% success rate. They may even get the first 4 right and look like a genius. However, overtime their accuracy will continue to approach 50%. Likewise, If this year 100 new strategies start on collective2 using high levels of leverage and 100 different combinations of signals, assets, etc. at the end of two years by pure chance some of them are going to be crushing the market!
Shouldn’t the analogy be that the trader/leader is not predicting a coin flip, but rather the stats measure the trader’s ability to make a free throw? Either you make the bucket or you don’t. Yes. 50/50 there when trying for a winning trade. Win or lose. But a skilled free thrower can do it a higher percentage of the time than a lower skilled thrower. All you are seeing over time is the diminishing skill of the thrower who is not a robot and can’t keep up his game. For example: Peter Lynch. And, even the game changes over time so an AI robot program unless tweaked cant stay a consistent winner.
I would sincerely appreciate your considered reply.
1 Like
No analogy is going to be perfect here including mine. Yes you can become a better trader. But I think the odds of that are much worse than people think.
I think a single person improving their free throw percentage is too gracious of an analogy. The hoop doesn’t move. It doesn’t compete against you. For every buyer there is a seller. If I buy TSLA stock its because I think I can make money. If someone else sells TSLA stock it is either because they think they can make better money elsewhere, be more safe, or buy something they want. Trading is competitive.
Sure I may be better at trading than Joe Shmoe, but for the most part that isn’t who you or I are competing against. We are competing against institutions that are massive, have huge resources, and intel. Likewise they are competing against each other too. If someone does find an inefficiency in the market they either take advantage of it until it is eroded, or the cat gets out of the bag and lots of people do. Even people that are good run out of room to be good. Warren Buffett and Peter Lynch are great business analysist. But when you start to manage so much money that you are the market it becomes hard to beat it with any real significance. Had Peter Lynch stayed in the game long enough he likely would have had the same experience.
This quote from Sapiens touches on the point
Not only that, but history is what is called a ‘level two’ chaotic system. Chaotic systems come in two shapes. Level one chaos is chaos that does not react to predictions about it. The weather, for example, is a level one chaotic system. Though it is influenced by myriad factors, we can build computer models that take more and more of them into consideration, and produce better and better weather forecasts. Level two chaos is chaos that reacts to predictions about it, and therefore can never be predicted accurately. Markets, for example, are a level two chaotic system. What will happen if we develop a computer program that forecasts with 100 per cent accuracy the price of oil tomorrow? The price of oil will immediately react to the forecast, which would consequently fail to materialise. If the current price of oil is $90 a barrel, and the infallible computer program predicts that tomorrow it will be $100, traders will rush to buy oil so that they can profit from the predicted price rise. As a result, the price will shoot up to $100 a barrel today rather than tomorrow. Then what will happen tomorrow? Nobody knows.”
In his post above, the author notes that any historical profit curves predating the apparent start of “auto-trading” should be [edit/see below:] regarded with skepticism. Without addressing the merits, or lack thereof, of this claim, I would like to state for the record that it is not always clear from C2’s pretty graphs when auto-trading actually began. For example, every trade recorded in both of my strategies from the moment of inception has in fact been mirrored from actual trades in my personal account. However, from late December until mid-January, I placed my strategies in “private” status while I reworked and further improved upon their already excellent Tradingview algorithms, refined the mechanics of the processes by which the trades they generate find their webhooky way into my BrokerTransmit IB accounts, and (incidentally) attended to some pressing personal matters. By so doing, I intentionally prevented an prospective subscribers from enrolling during that two-week period. Since making both strategies public again a few days ago, I’ve noticed that C2’s pretty graphs now make it appear as though I’ve just started trading them (see below). This is one case in which you are ill-advised to believe your lying eyes.


You are free, however, and in fact encouraged to ignore the flat two-week start on Vesuvius’s chart, which reflects time spent driving cross-country for 6 days to attend an out-of-state wedding and to visit seldom-seen relatives, which necessarily delayed my getting a new dedicated IB account set up, funded, webhooked to Tradingview (ask me how if interested), and connected via BrokerTransmit tdo C2.

I should restate that. I’m more skeptical of data pre-auto trading as certain types of trading don’t reflect reality very well without accounting for volume available and spreads. So I should restate the “disregard” and replace with I’m more skeptical of. Thank you for the feedback.
I believe that the stats on a new trader are not reflective at the beginning because of sample size errors. The more time the trader is on C2, the better the stats represent the trader’s ability. Also, the trader may or may not be trying new techniques at trading and be using the stats as feedback to improve their technique. Today I shot a free throw and made it. Was it luck? I bought a long call option on TSLA on a day that it was down 12.3%. The option cost me $450 and I made 10% in just a couple of minutes. I think that was a skill to do that. Random traders that I compete against have varying degrees of skill and resources backing them up. Because trader’s time horizons are all different, even on days like today for TSLA, skilled wins can be had.

I still like the basketball analogy a bit though. You either make the basket (win the trade) or you don’t (lose the trade). Of course you can complicate the analogy to incorporate other traders that you compete against as follows. Instead of a free throw. You are charging the basket when you enter the trade and the other traders are defending it. That is your competition wrinkle. It requires a skill to make the basket (win the trade) and I would definitely say that if you put a novice in that situation, the player charging the basket has no where near a 50/50 chance of making the basket as your analogy suggests.
It is incumbent upon the investors on C2 to find excellent players to bet upon.
How do you do this, that is find a good player?
I am experimenting with the following metric:

WLP * WLR > 1 is key. You want as high a number over 1.0 as possible. However your data has to be generated using at least 100 trades over at least 6 months. Further, you need to log this calculation every day and determine its variance. You want to see this number increasing over time (the player is improving). And, you want to see a low variance in the number (the player is consistent).
Yeah, skill is defined on one trade results. I think that two losing trades from 1/22 and 1/24 are showing the skill (or lack of it) better since the size of the sample is 2x larger. ![]()
1 Like
@InteractiveAssets: My note above has been edited to reflect your intent. ![]()
I like your logic. You say you can’t gauge a strategy or skill without a large sample size. But, I have a bad week, and that’s plenty enough sample size to throw me under the bus. Also, I like your logic that by losing a couple of trades, that refutes anything I have to say. Nice.
Market characteristics changes over time, that’s why a fixed trading strategy won’t always be #1, even a good trader can adjust. But human psychology (greed, fear) does not. I hope to develop a strategy that can beat human psychology in trading regardless market characteristics and conditions. ![]()
Why not? In my opinion the larger the sample the better estimate can be achieved. My sample is 2x larger.
Can you calculate the margin of error for one trade and two trades please? We can compare confidence level.
Thanks for the article. I agree with most of it but I am not sure agree with the following sentence.
'So the first thing I would check is whether or not the leader agrees that it is pretty much impossible to obtain higher rates of return without taking on higher levels of risk.“
Isn’t this saying that diversification does not work? I believe it is possible to obtain higher rates of return than the market by combining uncorrelated return streams and using leverage. I actually think this is less risky than buy and hold.
1 Like
It is a generalization so it likely doesn’t cover everything, but I think it could help if you provide an example of what you mean. When I think of diversification I think of a balanced portfolio. Statistically a balanced portfolio over the next 30 years isn’t likely to beat equities on average as it reduces the risk.
3 Likes
Here’s a simple example of a levered diversified portfolio of historically uncorrelated assets vs SPY.
https://www.portfoliovisualizer.com/backtest-portfolio?s=y&sl=78RpqHfQPTviP5VcwrZPuX
I would choose the levered one going forward.
And this is just diversification by assets not style. You could add different styles like trend following, mean reversion, etc to further reduce risk and improve performance.
The problem with not using leverage is that, as you point out, your “safety” assets that you need to include to reduce equity risk take up too much of your capital and reduce your returns.
Anyway, I appreciate that it was just a generalization, but I thought I would point this out,
1 Like
I agree diversification in general is good. I think this portfolio is more risky than a 100% equity index for two main reasons.
-
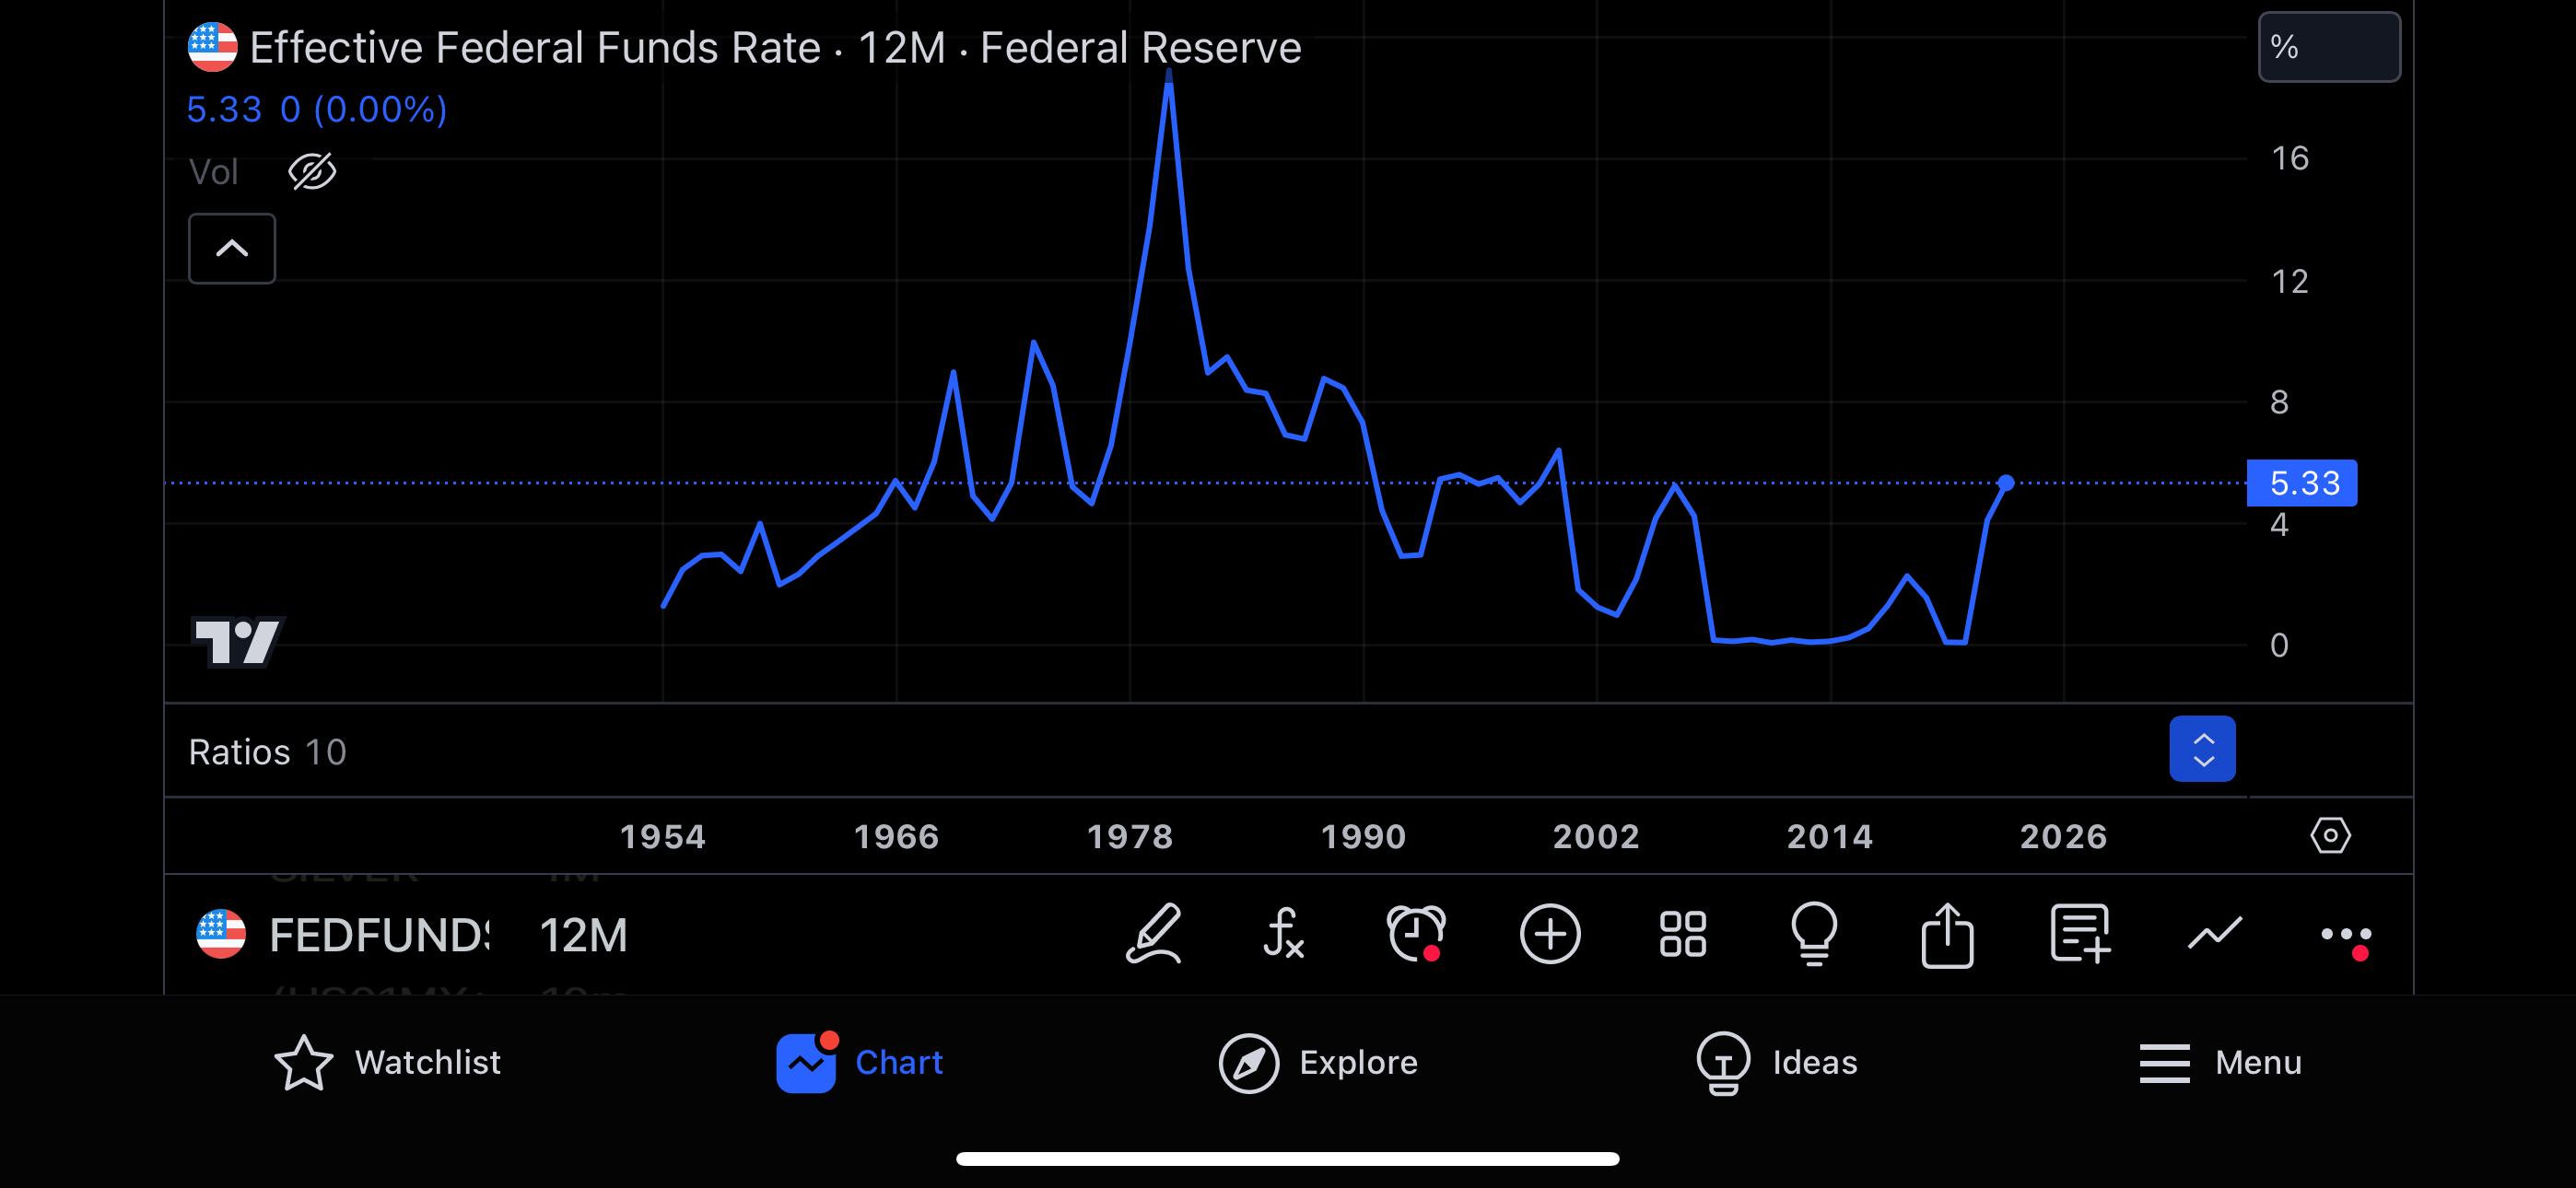
I think not including any debt cost for the leverage leads to overly optimistic results. Likewise there is very real risk that more historically normal leverage costs could drastically reduce the benefits of leverage which was historically very cheap in the period shown. Generally someone isn’t going to obtain leverage at a rate lower than fed funds plus 0.5%. See fed funds below to see how low leverage cost was in that period.
-
I don’t think currencies have any long term expected growth because currencies are non-productive assets. They aren’t like bonds that pay interest and they down pay dividends or grow profits. They are just a medium of exchange and trading them is a zero sum game. UUP had an amazing time since 2008 in comparison to the longer term history of DXY. Holding currency in large amounts is safe in a sense but gives you the new risk of low growth. See DXY below for context.

I appreciate your example and think it is a good demonstration of the difficulty in determining risk. The performance is no doubt great and even including cost of leverage during that time likely beats SPY, but I think it is more risky, but the type of risk that I think leads to worse returns than 100% equities other than in select periods of which 2008 to now is one. I would imagine that if you do this portfolio back test to the beginning of DXY and include cost of leverage using fed funds plus 0.5% it won’t look nearly as great.
Risk is one of those words that has so many meanings, but in general I stand by the idea that without taking on more risk your expected return doesn’t go up. Of course too much risk and your expected return goes down. Putting 1000% leverage in your example likely bankrupts it very fast. Likewise hold one’s entire portfolio in banks and not investing brings on inflation risk etc. I think trying to analyze risk of C2 strategies based on risk metrics like drawdown, sharpe, etc. is fun but mostly futile.

1 Like
