Medium- and Long-Term Strategies at Collective 2 with Relatively Good Results

Back in May 2019, MarekJ started a thread called “C2 best strategies (in my opinion).”

He reported the results of a screen for comparatively good strategies over time. He then updated that screen several times, slightly changing the criteria.

Here are the criteria that MarekJ used in his last screen, from March 21, 2020:

  1. Annual profit >15%
  2. Max DD <25%
  3. Longevity (>730 days, >99 trades)
  4. Avg profit > $99 (excluding most scalping strategies)
  5. Last 90 days profit does not =0 (excluding inactive strategies)

Today I have updated MarekJ’s last screen. Here are the results for Oct. 22, sorted by longevity:

(click to enlarge)

I want to emphasize that these are MarekJ’s criteria, not mine.

For me, two of the most important criteria besides profit, DD, and longevity would be that you want a Win % below 79% and a ratio of Avg. Gain / Avg. Loss greater than 1.2. See “Study: Risk Factors for Failure or Serious Trouble Are High Win % and Low Ratio of Avg Gain to Avg Loss.”

All of these five strategies score well outside the danger zone on these last two criteria.

Disclosure: My strategy, Innovation ETFs, is on the above list of 5 strategies.

1 Like

Wow where did you come from? Haven’t noticed you anywhere. However, your strategy has zero closed trades with actual fills verified by C2 for your accounts or AutoTrader accounts since May 2018. Can you explain why? Did you go private and resurface etc? Seems a little fishy that there are no real fills since then. Not even one autotrader?

I would think you would belong on the old timers leaderboard yet you aren’t there adding to my skepticism.

You make two claims (though you may have intended only one).

First, you claim supposedly no trades verified by C2. Obviously, all the trades in the record are verified by C2. You can look at the last 4-5 trades shown in the record and verify them yourself.

  • ARKK bought March 3 for $53.98; sold on Oct. 21 for $98.72 (82.9% profit)

  • ARKG bought March 3 for $35.03 sold on Oct. 21 for $68.88 (96.6% profit)

  • ARKF bought March 3 for $25.02 sold on Oct. 21 for $42.76 (70.9% profit)

  • ARKW bought March 3 for $64.70 and sold on Oct. 21 for $117.68 (81.9% profit)

  • ARKW bought Oct. 21 for $118.77 and sold on Oct. 21 for $117.68 (1.1% loss)

Just look at a chart for these ETFs at Yahoo or anywhere else on the dates indicated and you can see that these are legitimate prices. I closed out these positions precisely so people could see where the profits between March 3 and Oct. 21 came from.

Really, just check yourself. These were all executed in real-time at C2.

In the next response, I’ll address your second argument—no autotrades for a long time. My strategy was on more than one of MarekJ’s screens (under its name, “Bitcoin Related”). I changed the name this week to better reflect how the strategy has evolved, and dropped futures as an included class of investments because I think that they scared away some subscribers. Futures were never a large part of the strategy and my last futures trade closed in June 2019.

Anyone curious can look at the trading record for closed positions here:

The Old-Timers Leaderboard says clearly that it is for strategies at least 3 years old. MarekJ’s criterion was more than 2 years old. My third anniversary will be on Dec. 19. I assume that I will be put on that leaderboard then.

Great job holding onto those innovation funds! Just wondering about C2’s drawdown calculation for them, it is only showing ~2 to 3% for each position during the entire time you held those funds, yet some of them dropped 20 to 30% during that time. Can someone explain that?

I am talking about trades that C2 verifies occurred in real brokerage accounts not just the hypothetical C2 fills.

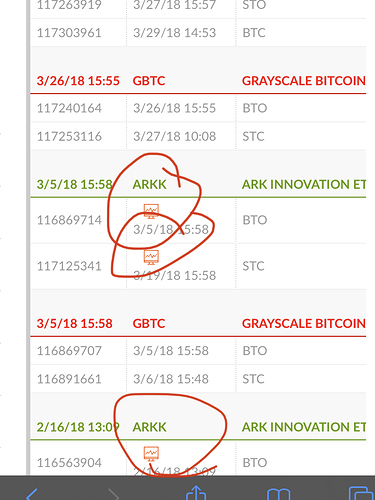
Go to your strategy

Click on “Show AutoTrade data”

Only the trades with the orange symbol I have circled are based off of real world fill prices. Something is weird here.

It appears that the DD % are not of the position but rather of the total portfolio. If you look at the DD in dollars, they show substantial DDs as the collapse of the market continued for several weeks after the positions were opened on March 3.

Thus, the opening position of $5,254 in ARKF shows a dollar DD of $1,654, but apparently that DD was only 2.11% of the portfolio at the time. I sold that position for 10,332 on Oct. 21. You will see very similar patterns for the other three ETFs bought on March 3, a large DD and a large eventual profit, but the C2 report shows only a small drop in % DD for the portfolio.

1 Like

So were you set to private for a long period until recently?

After adjusting the portfolio in early March as I thought was optimal for the middle of 2020, I did step away from actively managing it. [I don’t recall whether I set the number of subs at zero or whether it was just my not paying my monthly fee, but the strategy and its track record was visible during the whole time, not private. C2 showed that it was not being actively managed, but it was just that I was happy with the portfolio and wanted to wait to come back and seek subs this fall.] During that period (March 4 to Oct. 20, 2020), I did no trading at all—none. The nice run-up you see in the chart between March 4 and Oct. 20 was driven by the then-existing portfolio (most of which was because of the ETFs sold on Oct. 21).

As far as I remember, the strategy has been fully public at all times and was available for subs from the time it opened in 2017 until March 2020.

The only thing that is really new here is the name of the strategy.

As I mentioned in an earlier post on this thread, I renamed the strategy this week, changing it from “Bitcoin Related” to “Innovation ETFs.” I had done several name changes in the first week this strategy started in Dec. 2017 and then I dropped “Aggr” from the name in Sept. 2018.

You seem almost offended that you hadn’t heard of my strategy before. The first two strategies on the screen list have changed names, “The Momentum of Now” once, and “VIX Tactical Trader” four times. Other older strategies not on the screen that have changed names include “Smart Volatility Margin,” “SystematicBlue SP500,” and “The Spirit of Nicolas Darvas.”

MarekJ did a bunch of screens in his thread in 2019 and early 2020. Except for MarekJ’s first and last screen, I believe that in every screen, this strategy had the highest annual return of any of the strategies. I was left off Marek’s first screen because I had not yet met his threshold of 100 trades. I think that I was left off his last screen in March 2020 because I had not paid my monthly plan fee to C2.

I had a few subs, but even when I lowered my subscription fee substantially, I still had very few. I suspected that some were put off by trading Bitcoin related investments and the occasional use of Bitcoin futures. I have stopped using futures and focus now more on innovation ETFs.

In March 2020, the high risk environment led me to keep most of the portfolio in cash, but I put almost all of the portion that I was investing in innovation related ETFs, my quantitative analyses suggesting to me that they would do extremely well once the pain was over. I set up the portfolio as one that was very good for the middle of 2020 and stepped away from C2 for a while.

With the election approaching and the need for rebalancing, I came back this week, renamed the strategy, made some trades, and redid MarekJ’s screen.

3 Likes

Actually, the last autotrade in my account was in January of this year (2020). The position was short SQQQ, which has not been fully closed yet at C2, so it doesn’t appear in the public portion of the trading record.

On Jan. 8, 2020, I Bought to Close 1 share at $107.40 to close out a prior short sale of that share in a short position. My last prior short sale of SQQQ was many months before at $186.40, so the profit on that 1 share was about $79, minus whatever fees C2 applies.

At that time, one autotrader bought to close their position as part of that trade. In the detail below, C2 has adjusted that autotrader’s trade price to account for a later 5-to-1 split and shows it at $21.48, which is exactly one fifth of $107.40. Because no autotraders entered the position along with me, I don’t know when the sub joined the position, but it was very probably closed at a substantial % profit. I don’t know why C2 shows the Quantity as 4 (rather than 5); it could be an error or some good reason that I am not aware of. In either event, C2 shows one autotrade in Jan. of this year.

You have done very well and I hope it continues. I am just extremely cautious of any track record that isn’t produced based on real world fills. With your record you should get some subs willing to AutoTrade soon or you can set up Trades Own System verification.

Real world can be so different than recorded history of hypothetical trades only.

It has happened before that a seemingly fantastic strategy came out of nowhere then when real subs started following, things didn’t stay so perfect. I’m concerned the same could be happen here. If you are legit and got a good system, then overtime you will prove it with real fills too. I hope this happens and that you become a top leader on C2. If I sound skeptical it is because things happen like below:

Strategy out of nowhere

Questions about where it came from

You even posted in the thread and made some great points. So maybe you are legit.

Strategy has a major peak nearly right when it is posted to the forums then proceeds to have performance that is nothing like the performance shown prior to the forum post/consistent real world fills

Subs lose money and leave C2…

1 Like

Thanks for the change in tone. I was thinking of saying that you were acting a bit too much like your namesake, Dwight Schrute, but I thought that you might not appreciate that comment.

Earlier today, I was asking myself why I was bothering to come back here after a brief hiatus. I manage millions of dollars of my family’s money, and the most I might make in a year here would just buy me a couple cases of good wine.

I thought it might be fun again here–and I still hope it will be.

Other than my crazy initial returns in Dec. 2017 and Jan. 2018, I don’t think that the returns in my strategy are so fantastic. I started on the very day (Dec. 19, 2017) that the Bitcoin bubble burst. And, given that I seem to remember that I started the day bullish, I had to be extremely nimble to follow my model when it turned down and to work through that craziness.

In the money I manage, I did better both in 2020 (+37%) and in 2019 (+30%) than in my strategy at C2, though my performance here was better in 2018 than in the family money I manage. Remember that 2019 was a strong up year in the market overall and 2020 so far has been strongly up for technology.

Good luck with your own strategy!

3 Likes